Fig. 21
Download original image
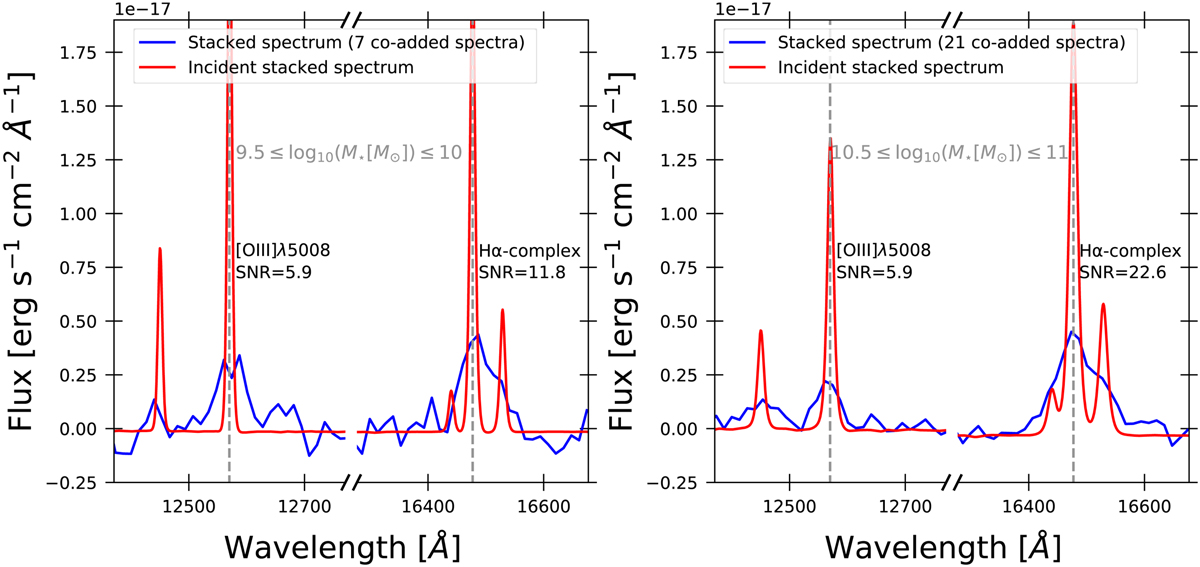
Results of the stacking analysis performed on two Hα-detected samples with different total stellar mass (M*) unveiling the [O III]λ5008 otherwise too faint to be detected on the single co-added spectra. Left: stacking analysis on seven co-added spectra with 9.5 ≤ log10(M* [M⊙]) ≤ 10.0. Right: stacking analysis on 21 co-added spectra with 10.5 ≤ log10(M* [M⊙]) ≤ 11.0.
Current usage metrics show cumulative count of Article Views (full-text article views including HTML views, PDF and ePub downloads, according to the available data) and Abstracts Views on Vision4Press platform.
Data correspond to usage on the plateform after 2015. The current usage metrics is available 48-96 hours after online publication and is updated daily on week days.
Initial download of the metrics may take a while.