Fig. 20
Download original image
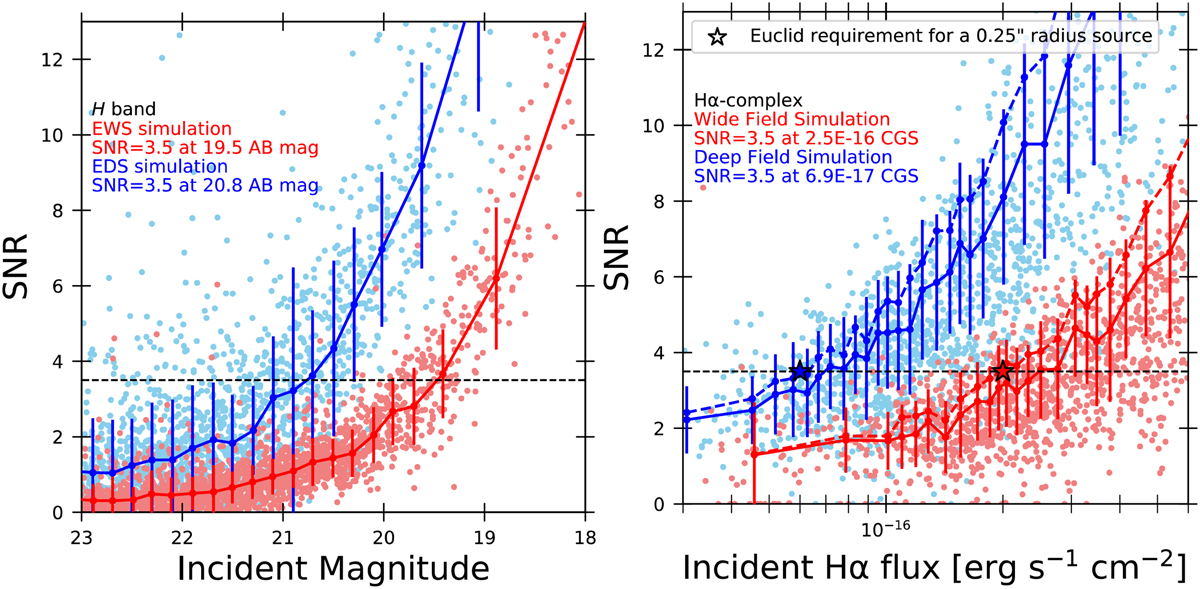
Results of the NISP detection capabilities for the continuum and emission lines. Left: S/N of the continuum measurements versus the incident magnitude in the H band. Right: S/N of the Hα-complex measurements versus the incident Hα flux. Results are indicated for the EWS simulation in red and for the and EDS simulation in blue. The red and blues lines are the median S/N calculated in incident magnitude (left) and Hα flux (right) bins including a fixed number of 50 sources. The error bars show the MAD. The dashed red and blue lines in the right panel indicate the median value corrected for the size effect on the S/N (see Sect. 5.1.2). The dashed black line indicates the S/N of 3.5 which we used to infer the detection limits for the EWS and EDS indicated on the figure and reported in Table 2.
Current usage metrics show cumulative count of Article Views (full-text article views including HTML views, PDF and ePub downloads, according to the available data) and Abstracts Views on Vision4Press platform.
Data correspond to usage on the plateform after 2015. The current usage metrics is available 48-96 hours after online publication and is updated daily on week days.
Initial download of the metrics may take a while.