Fig. 2
Download original image
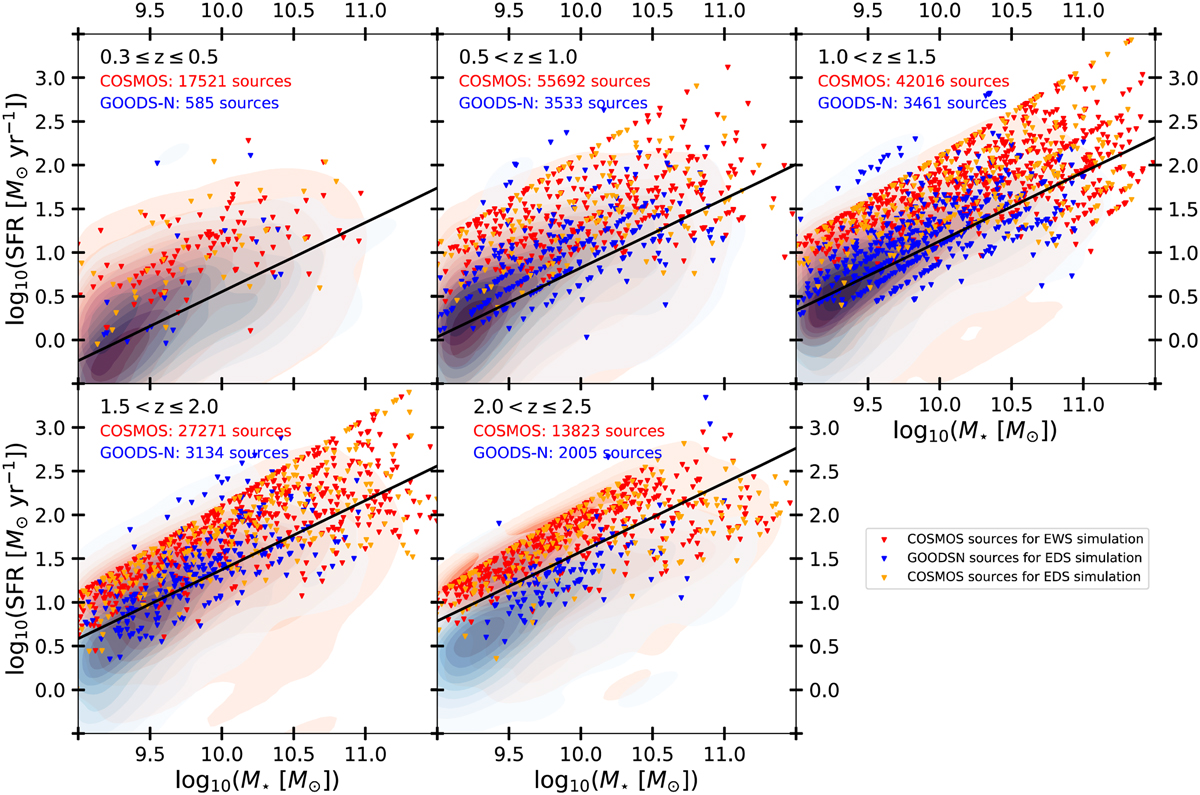
SFR versus total stellar mass diagram for five different redshift bins. The solid black line shows the normalisation of the ‘main sequence’ from Rodighiero et al. (2011) derived at z ~ 2 that we extrapolated to different redshift using the redshift dependence proposed by Sargent et al. (2014). Readers can refer to the caption of Fig. 1 for a colour assignment description.
Current usage metrics show cumulative count of Article Views (full-text article views including HTML views, PDF and ePub downloads, according to the available data) and Abstracts Views on Vision4Press platform.
Data correspond to usage on the plateform after 2015. The current usage metrics is available 48-96 hours after online publication and is updated daily on week days.
Initial download of the metrics may take a while.