Fig. 18
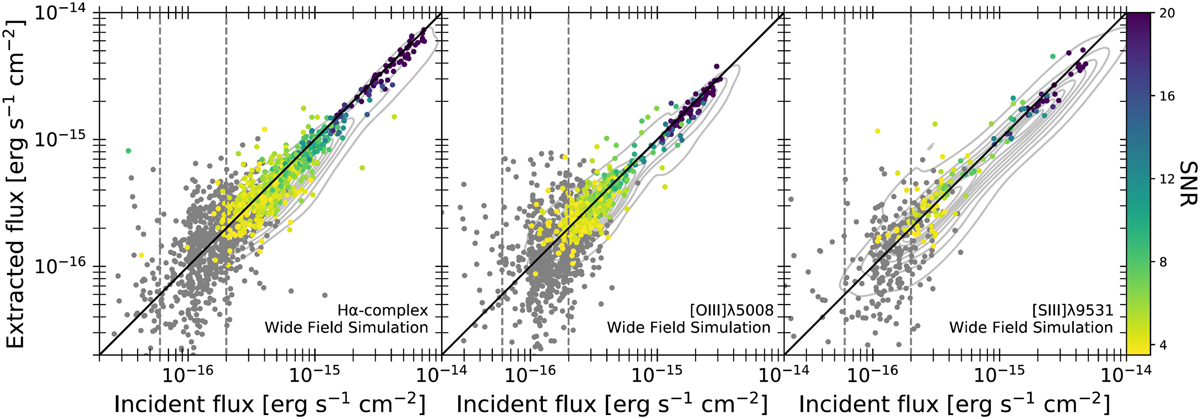
Download original image
Results of the EWS simulation comparing the extracted versus incident fluxes of the Fto-complex (left), [O III]λ5008 (middle) and [S III]λ9531 (right) emission lines. The scattered circles are corrected for the estimated loss due to the aperture (see Sect. 5.1.3). The sources are colour-coded with the S/N of the emission line measurement, as shown by the right-side colour bar. The grey circles are objects with S/N < 3.5. The black diagonal line shows the 1:1 ratio. The grey dotted lines are the requirements for the Euclid spectroscopic detection limit for the EDS (leftmost) and EWS (rightmost) surveys. The contours correspond to iso-proportions of the distribution density of our measurements, starting at 20% with a 10% step, before applying the correction due to the aperture loss.
Current usage metrics show cumulative count of Article Views (full-text article views including HTML views, PDF and ePub downloads, according to the available data) and Abstracts Views on Vision4Press platform.
Data correspond to usage on the plateform after 2015. The current usage metrics is available 48-96 hours after online publication and is updated daily on week days.
Initial download of the metrics may take a while.