Fig. 16
Download original image
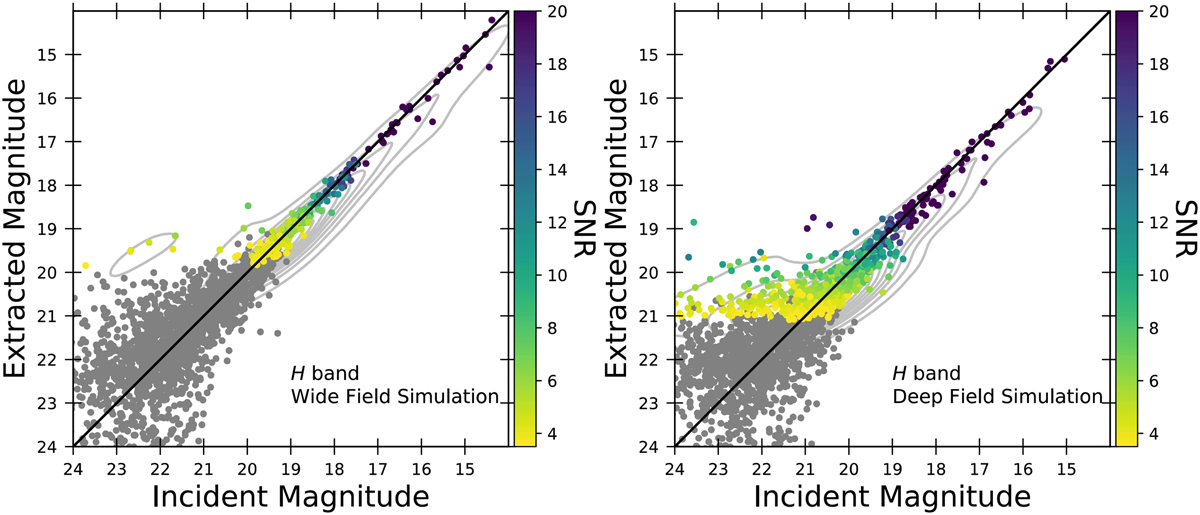
Results of the EWS simulation (left) and of the EDS simulation (right) comparing the measured extracted versus incident H band magnitudes calculated in the AB system. The magnitude is obtained convolving the extracted and incident spectra with the transmission curve of the ΗΈ filter on the mutual wavelength range between the RGS passband and ΗΈ. The scattered circles are corrected for the estimated loss due to the aperture (see Sect. 5.1.3). The sources are colour-coded with the S/N, as shown by the right-side colour bar, and the grey circles are objects with S/N < 3.5. The black diagonal line shows the 1:1 ratio. The contours are the iso-proportions of the distribution density of our measurement, starting at 20% with a 10% step, before applying the correction due to the aperture loss.
Current usage metrics show cumulative count of Article Views (full-text article views including HTML views, PDF and ePub downloads, according to the available data) and Abstracts Views on Vision4Press platform.
Data correspond to usage on the plateform after 2015. The current usage metrics is available 48-96 hours after online publication and is updated daily on week days.
Initial download of the metrics may take a while.