Fig. 14
Download original image
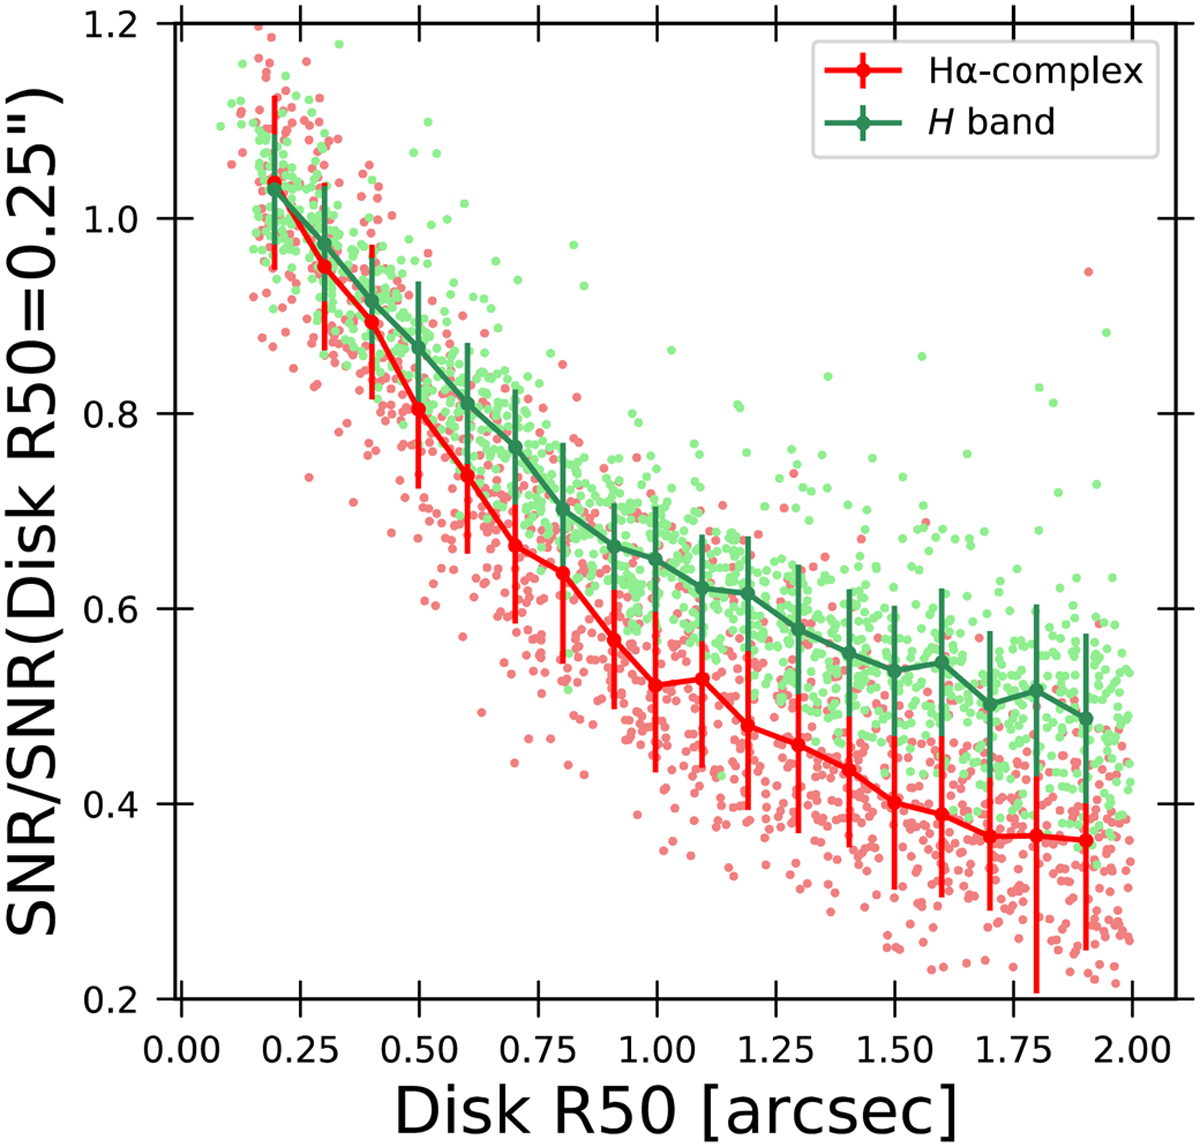
S/N of the extracted Ηα-complex measurements (red) and extracted continuum measurements (green) normalised by the median S/N for sources with a disk half-light radius (R50) of 0.″25 as a function of the disk R50. The lines and error bars show the normalised median S/N and MAD values calculated in disk R50 bins including a fixed number of 50 sources. Results are presented for a sub-sample of 1248 sources with all morphological parameters set at their default value (see Sect. 2.3.2) except the disk R50, which varies from 0.″1 to 2″.
Current usage metrics show cumulative count of Article Views (full-text article views including HTML views, PDF and ePub downloads, according to the available data) and Abstracts Views on Vision4Press platform.
Data correspond to usage on the plateform after 2015. The current usage metrics is available 48-96 hours after online publication and is updated daily on week days.
Initial download of the metrics may take a while.