Fig. 13
Download original image
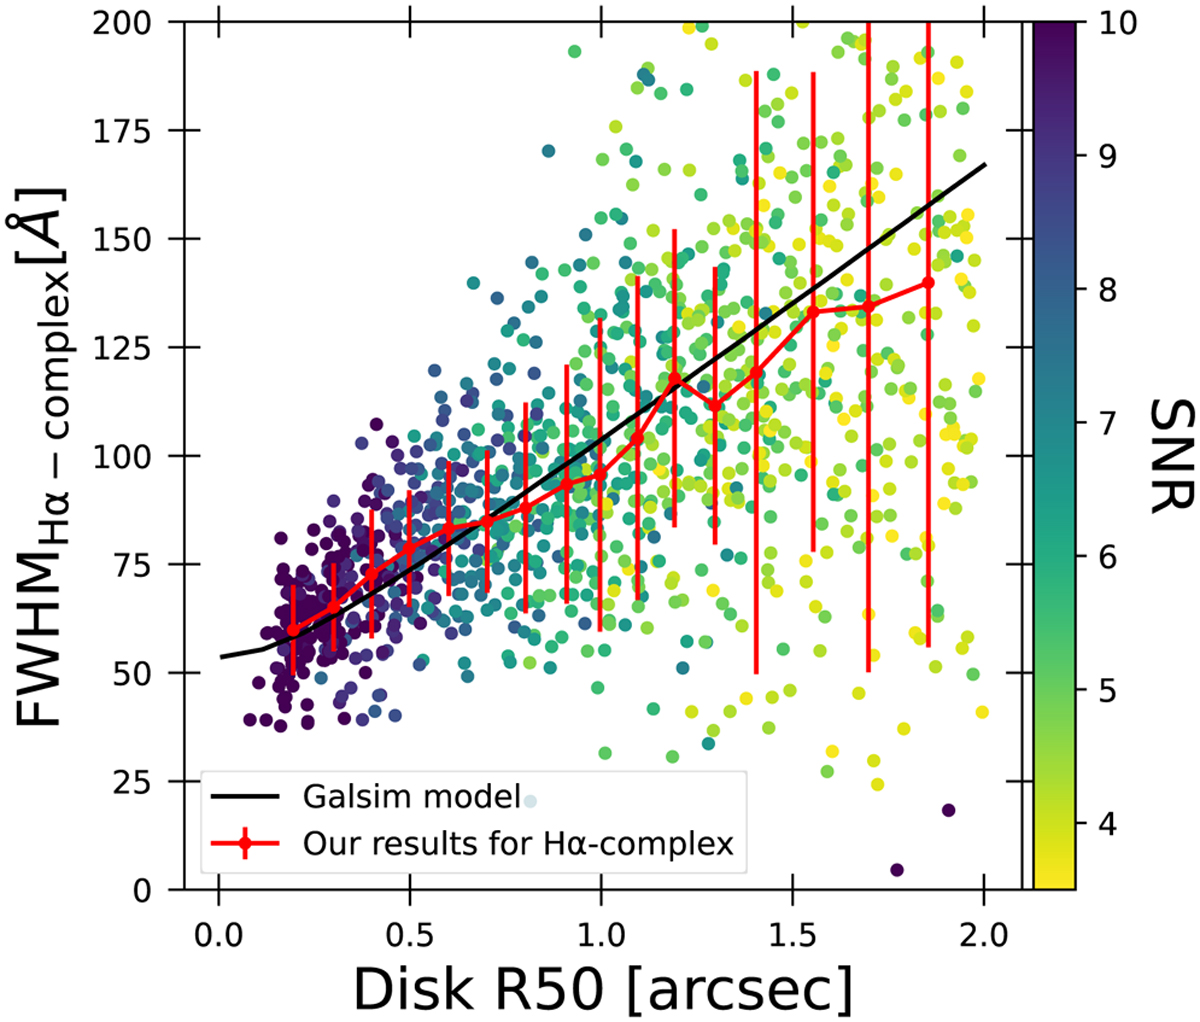
FWHM measured on the extracted Hα-complex lines as a function of the object disk R50 in arcseconds. The FWHM has been measured on a sample of 1248 sources with all morphological parameters set at their default value (see Sect. 2.3.2) except the disk R50 that ranges from 0.″1 up to 2″. The red line shows the median FWHM calculated in disk R50 bins including a fixed number of 50 sources. The error bars show the median absolute deviation (MAD). The solid black line shows the model obtained from GALSIM (see explanation in the text).
Current usage metrics show cumulative count of Article Views (full-text article views including HTML views, PDF and ePub downloads, according to the available data) and Abstracts Views on Vision4Press platform.
Data correspond to usage on the plateform after 2015. The current usage metrics is available 48-96 hours after online publication and is updated daily on week days.
Initial download of the metrics may take a while.