Fig. 12
Download original image
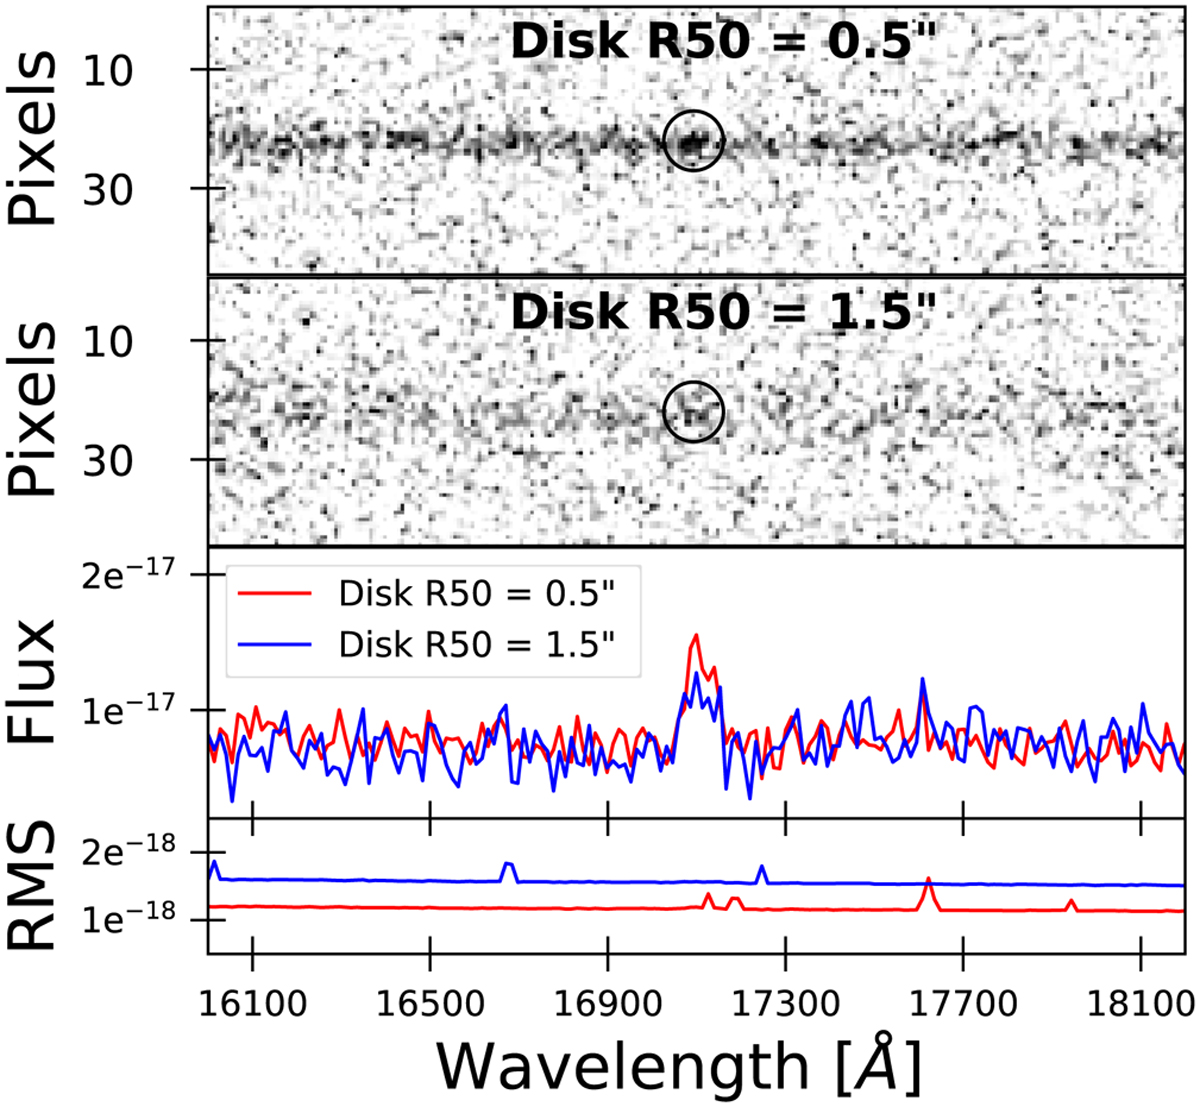
Illustration of the disk R50 effect on the quality of the spectra. Top two panels: 2D extracted spectra obtained from one dither of the EWS simulation for two sources with disk R50 = 0.″5 and disk R50 = 1.″5 centred on the Hα-complex line which is highlighted with a black circle. Bottom two panels: the corresponding ID extracted spectra, resulting from the SIR data processing pipeline on four dithered frames. The signal and RMS spectra are shown and centred on the Hα-complex line measured with S/N of 9.1 for the 0.″5 source (red line) and 4.5 for the 1.″5 source (blue line). Values of the flux and RMS on the vertical axis are expressed in erg s−1 cm−2 Å−1.
Current usage metrics show cumulative count of Article Views (full-text article views including HTML views, PDF and ePub downloads, according to the available data) and Abstracts Views on Vision4Press platform.
Data correspond to usage on the plateform after 2015. The current usage metrics is available 48-96 hours after online publication and is updated daily on week days.
Initial download of the metrics may take a while.