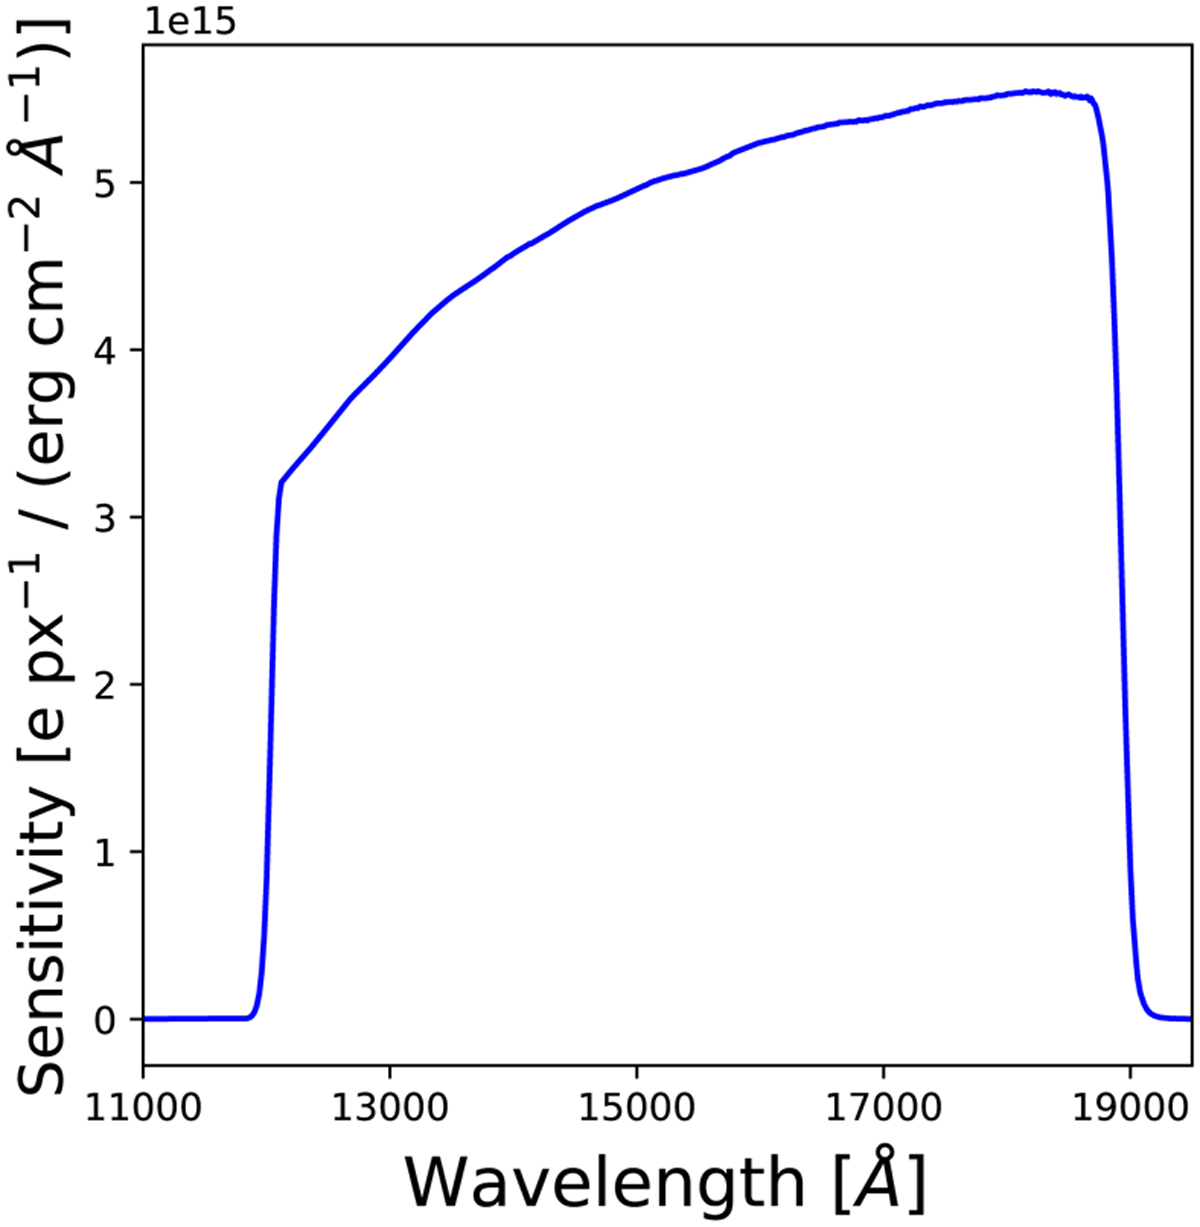
Fig. 10
Download original image
Wavelength-dependent sensitivity curve of the RGS inferred by TIPS using the NISP and payload module transmission curves characterised at nine positions of the NISP focal plane during the ground-test campaigns (Waczynski et al. 2016; Barbier et al. 2018; Costille et al. 2019; Maciaszek et al. 2022) and spatially averaged in the simulations computing the arithmetic mean of the transmissions measured at the nine positions. Units on the vertical axis are in e s−1 px−1 / (erg s−1 cm−2 Å−1). This quantity connects the spectra extracted from the slitless data to the physical units presented in this paper.
Current usage metrics show cumulative count of Article Views (full-text article views including HTML views, PDF and ePub downloads, according to the available data) and Abstracts Views on Vision4Press platform.
Data correspond to usage on the plateform after 2015. The current usage metrics is available 48-96 hours after online publication and is updated daily on week days.
Initial download of the metrics may take a while.