Fig. 1
Download original image
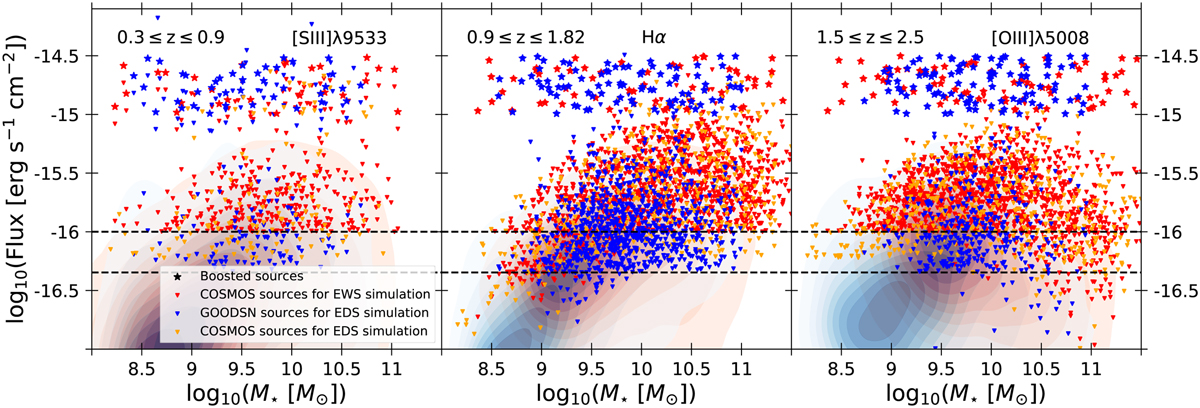
Distribution of emission line fluxes as a function of the mass. This figure presents the selected sources to be simulated considering the limits set for the EWS and EDS in terms of the emission line detection limits. The sources represented by stars are the sources with boosted emission line flux (explained in the text). The limits are set below the respective Euclid requirements in order to characterise emission line detection capability around these requirements. The limits have been set at 1 × 10⁻¹⁶ erg s−1 cm−2 (top dashed black line) for the EWS simulation and at 4.5 × 10⁻¹⁷ erg s−1 cm−2 (bottom dashed black line) for the EDS simulation. The red and blue shaded regions correspond to iso-proportions of the distribution density of the L16 and B19 catalogues, respectively, starting at 20% with a 10% step. The red triangles are sources from L16 selected for the EWS simulation. The blue triangles are sources from B19 selected for the EDS simulation, which has been completed with sources from L16 (orange triangles) to reach the maximum number of sources possible in a simulated pointing. Left: distribution of the [S III]λ9533 fluxes in the redshift range allowing detection with the RGS. Middle: distribution of the Hα fluxes. Right: distribution of the [O III]λ5008 fluxes.
Current usage metrics show cumulative count of Article Views (full-text article views including HTML views, PDF and ePub downloads, according to the available data) and Abstracts Views on Vision4Press platform.
Data correspond to usage on the plateform after 2015. The current usage metrics is available 48-96 hours after online publication and is updated daily on week days.
Initial download of the metrics may take a while.