Fig. 8
Download original image
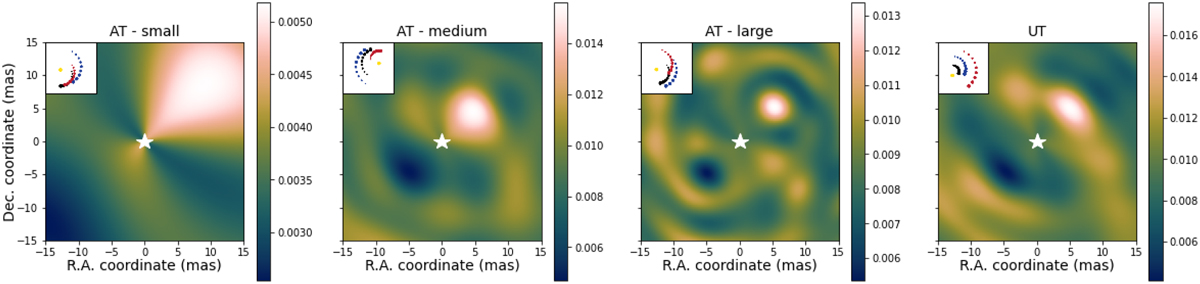
Collinearity maps for different four-telescope VLTI interferometric array configurations over a ±15 mas FOV. These maps were computed from the data-set acquired from simulated kernel-nulling observations of HIP 107773 over a ±4 h range of hour angle. For these simulations in the absence of perturbations, an off-axis companion with a contrast of c = 10−3 was placed at α = +5.0 mas, δ = +5.0. For the small (A0-B2-D0-C1) configuration of the ATs, we observe a maximum of collinearity confined to the top right of the map. Owing to the low spatial resolution provided by this array, we cannot infer the exact location of the companion. The collinearity map is improved with the use of the medium (K0-G2-D0-J3) AT configuration. Here, we see a broad maximum of collinearity around the location of the companion. The longer baselines provided by the large (A0-G1-J2-J3) AT configuration and the UTs will result in a higher spatial resolution. This is made evident in the collinearity maps computed with these array configurations by a narrower maximum of collinearity around the location of the companion. The scale on the right of each collinearity map denotes the amplitude of the companion signal, which is proportional to its contrast. The pointings of the projected array are shown inset in each collinearity map. A white star in each map marks the location of the central star where the rejection by the nuller is optimal.
Current usage metrics show cumulative count of Article Views (full-text article views including HTML views, PDF and ePub downloads, according to the available data) and Abstracts Views on Vision4Press platform.
Data correspond to usage on the plateform after 2015. The current usage metrics is available 48-96 hours after online publication and is updated daily on week days.
Initial download of the metrics may take a while.