Fig. 5
Download original image
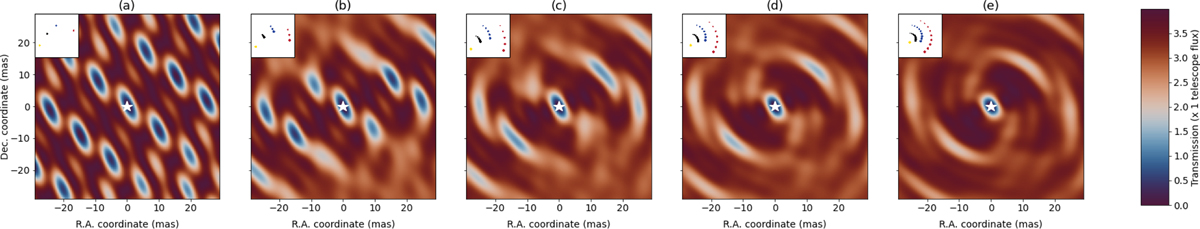
Nuller global throughput maps at various observation periods of a kernel-nuller at the focus of the four VLTI UTs, observing the ±30 mas FOV surrounding the target HIP 107773. The throughput maps allow us to assess the overall off-axis efficiency of a nulling observing sequence. In panel a, we see the throughput map for a single snapshot pointing at zenith. For the following maps, we computed the throughput maps at each pointing and then co-added the maps over the range of hour angle: panel b is the throughput map for three equally spaced pointings over a ±1 h range of hour angle, panel c is that for five equally spaced pointings over ±2 h, panel d for seven equally spaced pointings over ±3 h, and panel e for nine equally spaced pointings over ±4 h. The pointings of the projected array are shown inset in each throughput map. A white star in each map marks the location of the central star where the rejection by the nuller is optimal, as shown by the on-axis null. The five maps share the same colour bar where the transmission is expressed in units of the planet flux.
Current usage metrics show cumulative count of Article Views (full-text article views including HTML views, PDF and ePub downloads, according to the available data) and Abstracts Views on Vision4Press platform.
Data correspond to usage on the plateform after 2015. The current usage metrics is available 48-96 hours after online publication and is updated daily on week days.
Initial download of the metrics may take a while.