Fig. 4
Download original image
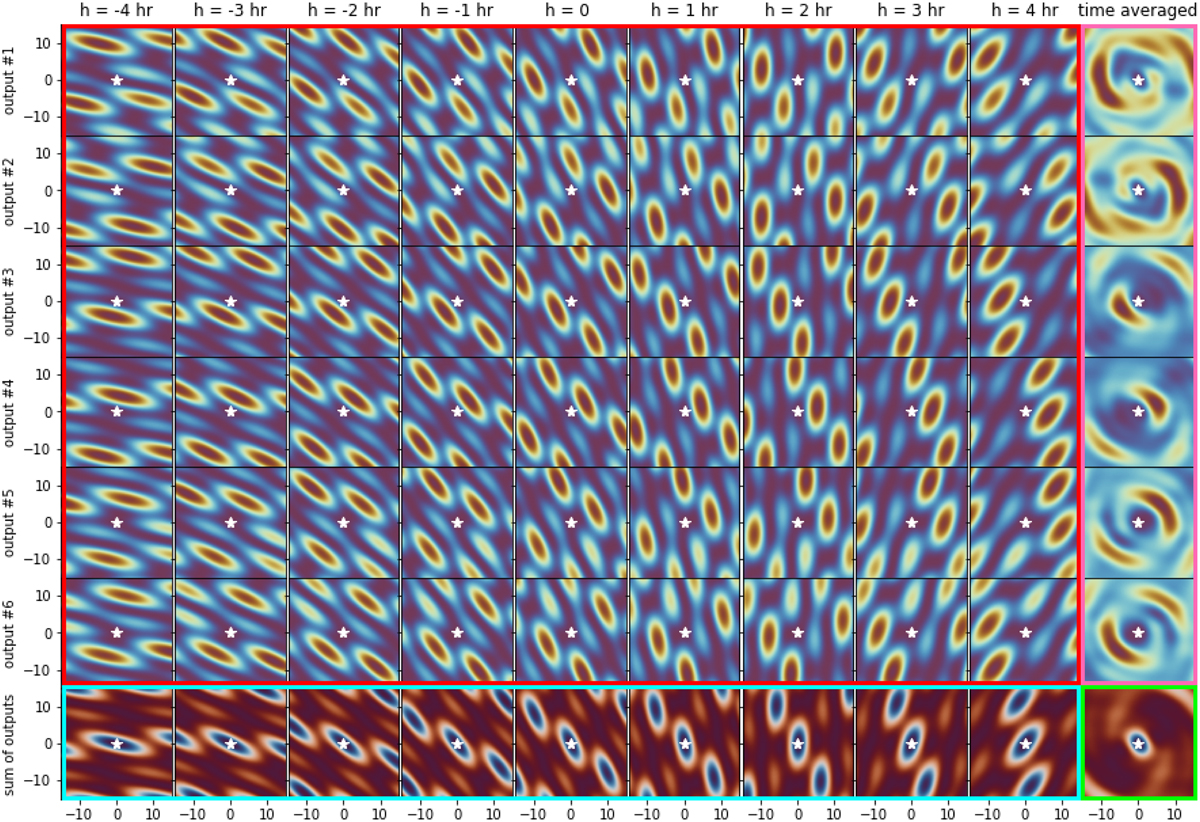
Evolution of the nuller output transmission maps of a kernel-nuller at the focus of the four VLTI UTs, observing the ±15 mas FOV surrounding the target HIP 107773. The figure shows four blocks of maps altogether, which provide insights into the behaviour of the nulled outputs. The first block (red contour, top left) of 54 maps shows how the transmission maps of the six nuller outputs evolve over a ±4 h observing period centred on the target transit time (h = 0). These maps all share the same colour scale as Fig. 2 and show that at any instant, the transmission for at least part of the FOV per output can reach up to the totality of the flux collected by two telescopes. We can see the transmission patterns gradually rotating in a clockwise direction with time, scanning the FOV to intercept the light of any off-axis feature of the astrophysical scene. A white star in each plot marks the location of the central star where the transmission for all channels is equal to zero, by design. The second block (pink contour, rightmost column) of six maps shows the time-average of each nuller output transmission map, using the same colour scales and conventions. Looking at these, we can visually confirm that the outputs do indeed work in pairs characterised by asymmetric responses. The third block (blue contour, bottom row) of nine maps shows how at any instant, the sum of all output maps is spatially distributed. This series of images uses the same colour scale as Fig. 5. Summing the outputs shows that the overall instantaneous sensitivity of the nuller is much more uniform over the FOV, even if it nevertheless systematically features off-axis replicas of the on-axis null, which are referred to as transmission holes. The fourth block (green contour, single bottom right map) shows the time-averaged global throughput, which reveals that with a sufficiently wide observing window, the FOV is uniformly covered, and the nuller will be able to capture the light of a companion regardless of where it may reside.
Current usage metrics show cumulative count of Article Views (full-text article views including HTML views, PDF and ePub downloads, according to the available data) and Abstracts Views on Vision4Press platform.
Data correspond to usage on the plateform after 2015. The current usage metrics is available 48-96 hours after online publication and is updated daily on week days.
Initial download of the metrics may take a while.