Fig. 1
Download original image
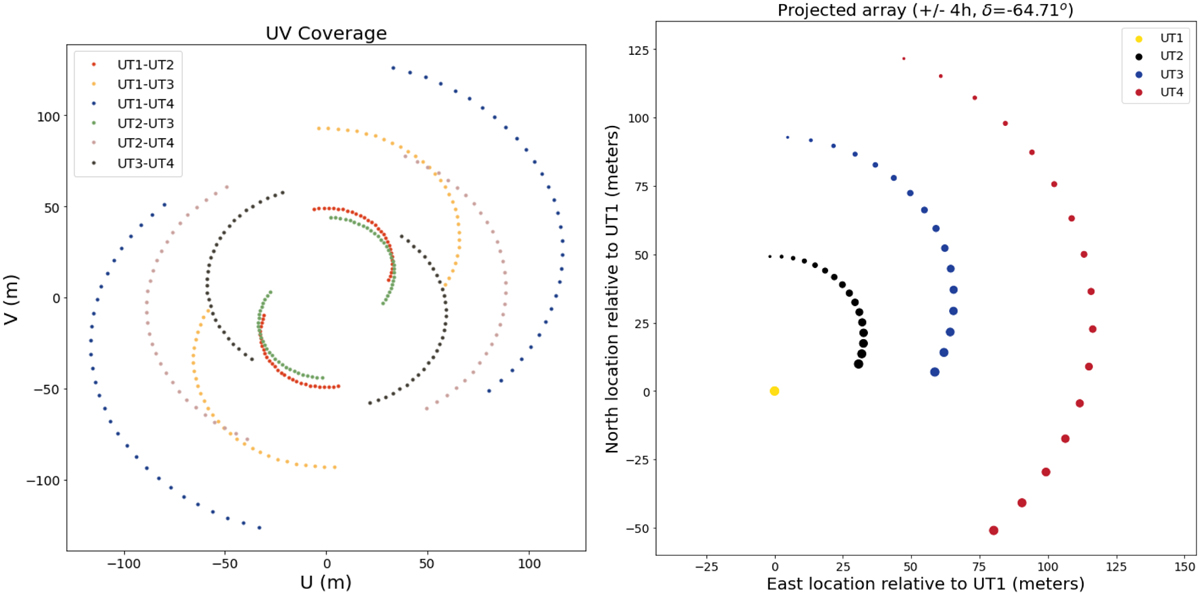
Evolution of the (u, v) plane coverage (left panel) and the projected array (right panel) of the four VLTI UTs observing the target HIP 107773 over a ±4 h range of hour angle. In the left figure we see the 2D projection of the six baselines of the four UTs on a plane perpendicular to the direction of the target. As the Earth rotates, the baselines formed by pairs of telescopes sample the complex visibility function at spatial frequencies labelled with coordinates u and v, sweeping out tracks that are rather circular on account of the favourable celestial location. In the right figure we see the projected geometry of the interferometric array relative to UT1, which is chosen as a reference. The locations of UT2, UT3, and UT4 from the point of view of the source appear to move around to UT1 in a clockwise direction.
Current usage metrics show cumulative count of Article Views (full-text article views including HTML views, PDF and ePub downloads, according to the available data) and Abstracts Views on Vision4Press platform.
Data correspond to usage on the plateform after 2015. The current usage metrics is available 48-96 hours after online publication and is updated daily on week days.
Initial download of the metrics may take a while.