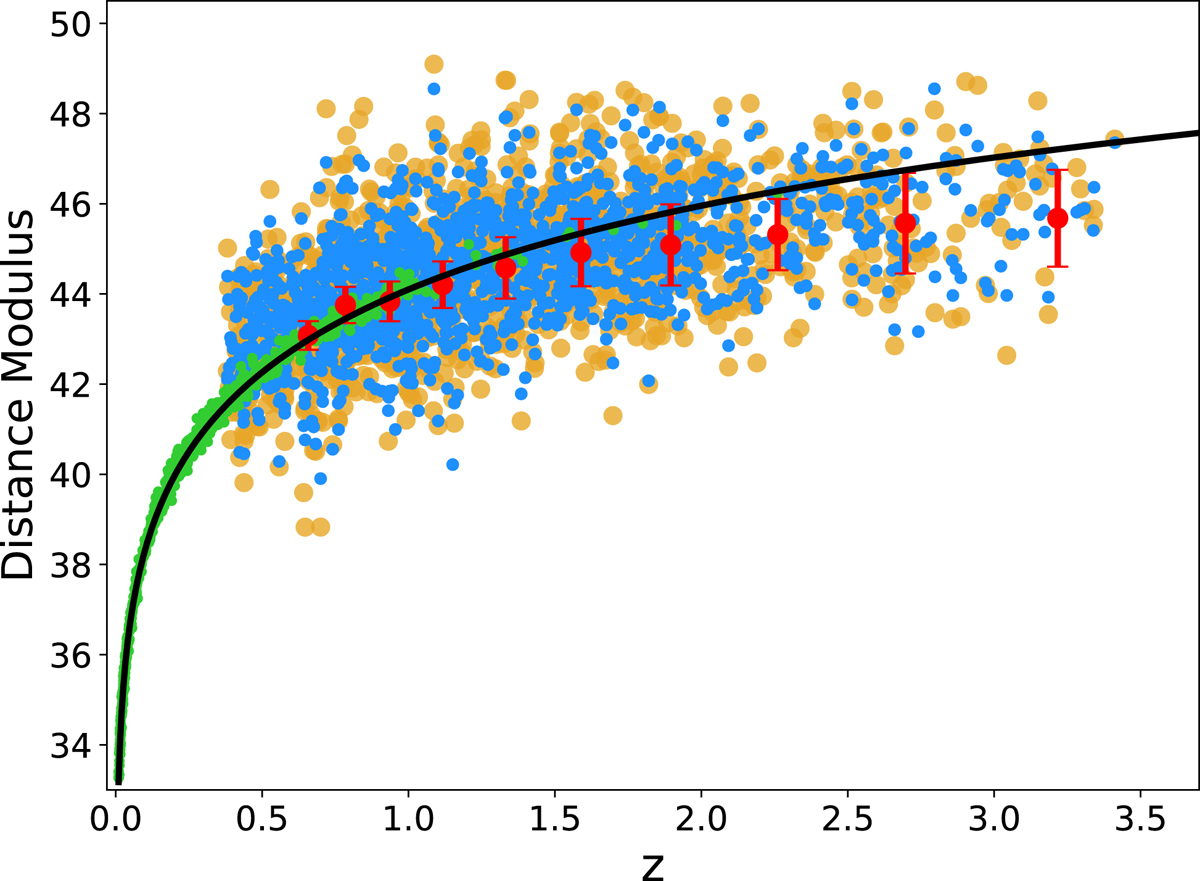
Fig. 8.
Download original image
Hubble diagram of supernovae and quasars. Green points are supernovae Ia from the Pantheon sample (Scolnic et al. 2018), yellow points are quasars with distances derived using the photometric UV fluxes, blue points are quasars with distances derived using the spectroscopic UV fluxes, and red points are the average distance modulus values for spectroscopic quasars in the individual redshift bins. The normalisation parameter for quasars is chosen in order to match that of supernovae Ia. As in our previous studies (Risaliti & Lusso 2019), we do so by cross-matching the Hubble diagram of quasars with that of supernovae in the common redshift range. The black line represents the prediction of a flat ΛCDM model with ΩM = 0.3.
Current usage metrics show cumulative count of Article Views (full-text article views including HTML views, PDF and ePub downloads, according to the available data) and Abstracts Views on Vision4Press platform.
Data correspond to usage on the plateform after 2015. The current usage metrics is available 48-96 hours after online publication and is updated daily on week days.
Initial download of the metrics may take a while.