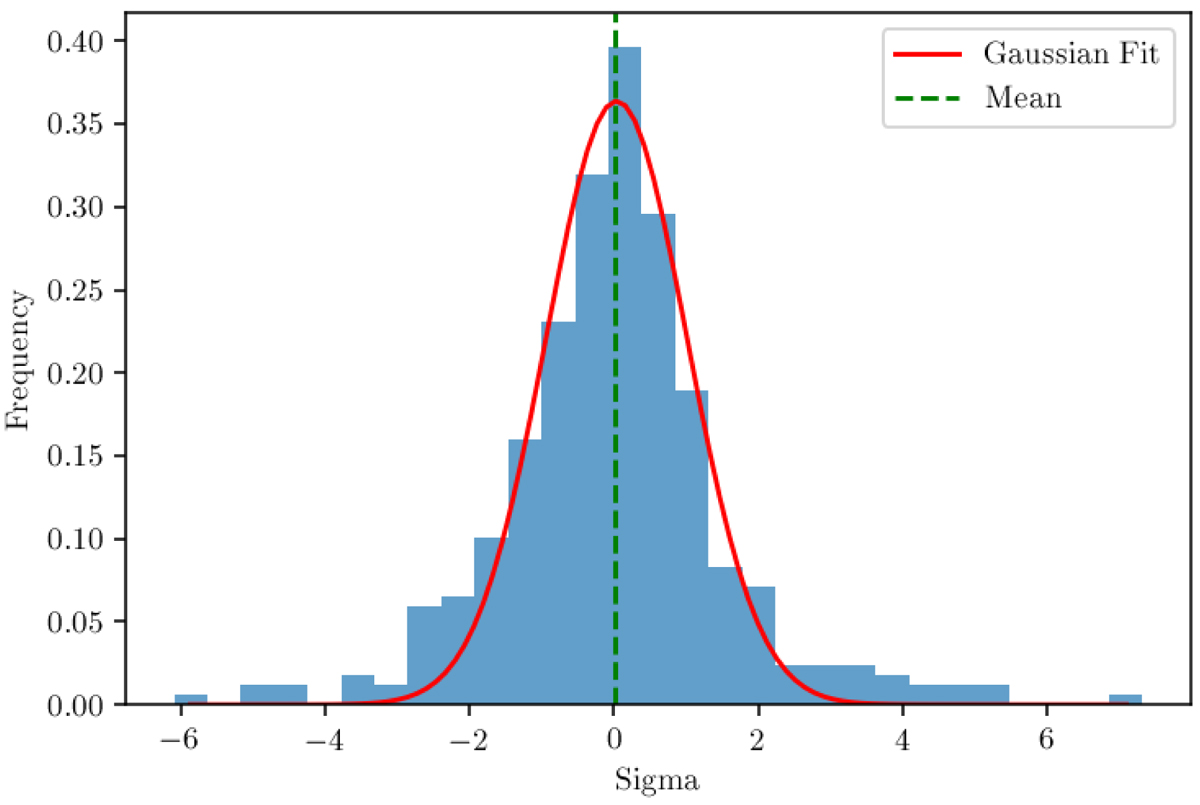
Fig. B.3.
Download original image
Histogram of differences between photometric and spectroscopic X-ray fluxes at 2 keV, shown in units of standard deviations. The red line shows the results of a Gaussian fit, which shows that the distribution is centred around zero. There is no significant skewness, as the skewness parameter turns out to be k = 0.27 ± 0.30. This shows that there is no systematic shift between the two quantities.
Current usage metrics show cumulative count of Article Views (full-text article views including HTML views, PDF and ePub downloads, according to the available data) and Abstracts Views on Vision4Press platform.
Data correspond to usage on the plateform after 2015. The current usage metrics is available 48-96 hours after online publication and is updated daily on week days.
Initial download of the metrics may take a while.