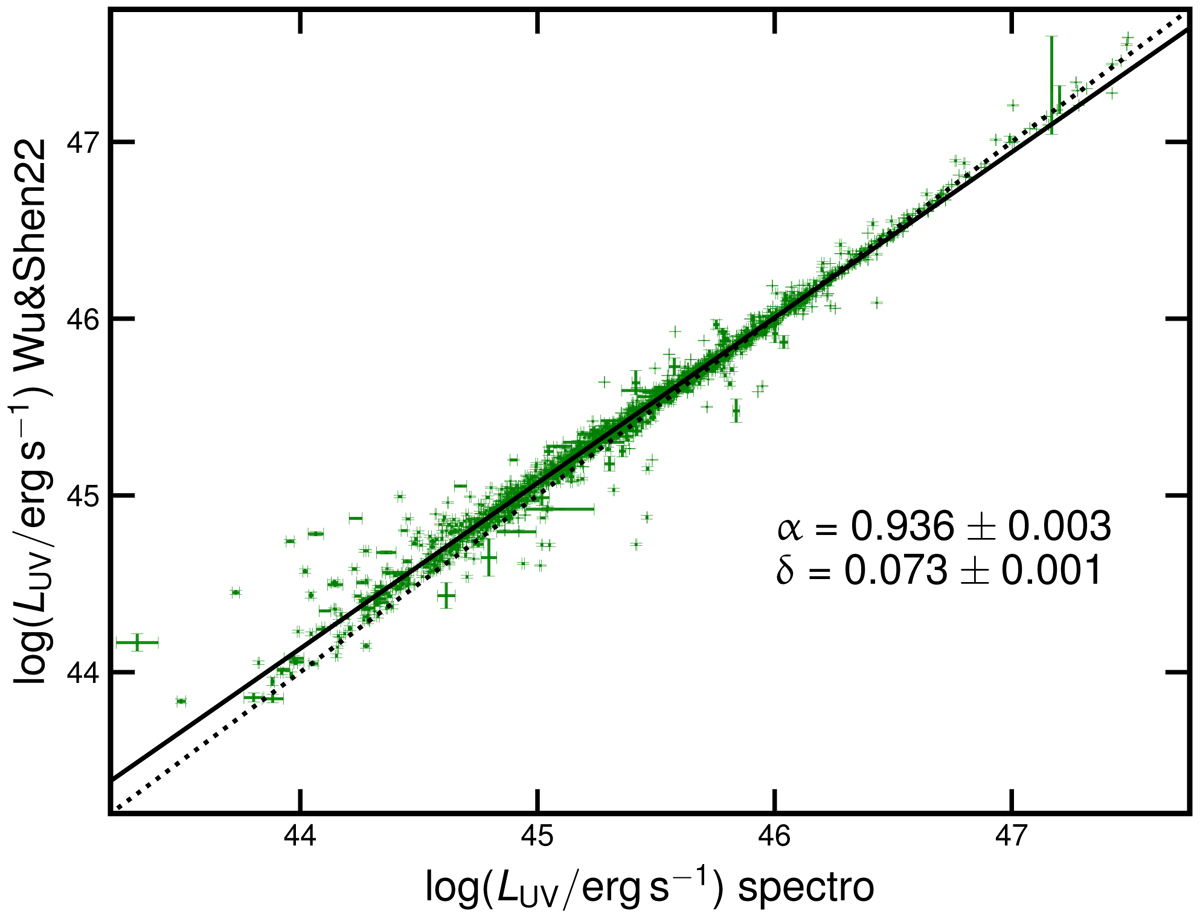
Fig. A.3.
Download original image
Comparison between monochromatic luminosity at 2500 Å obtained from our spectral analysis and the one from the Wu & Shen (2022), in logarithmic units (erg s−1). The dotted line is the one-to-one relation. We also report the best-fit slope and dispersion and the resulting best-fit regression line with the solid black line. There is an overall good agreement between the two measurements.
Current usage metrics show cumulative count of Article Views (full-text article views including HTML views, PDF and ePub downloads, according to the available data) and Abstracts Views on Vision4Press platform.
Data correspond to usage on the plateform after 2015. The current usage metrics is available 48-96 hours after online publication and is updated daily on week days.
Initial download of the metrics may take a while.