Open Access
Fig. 1.
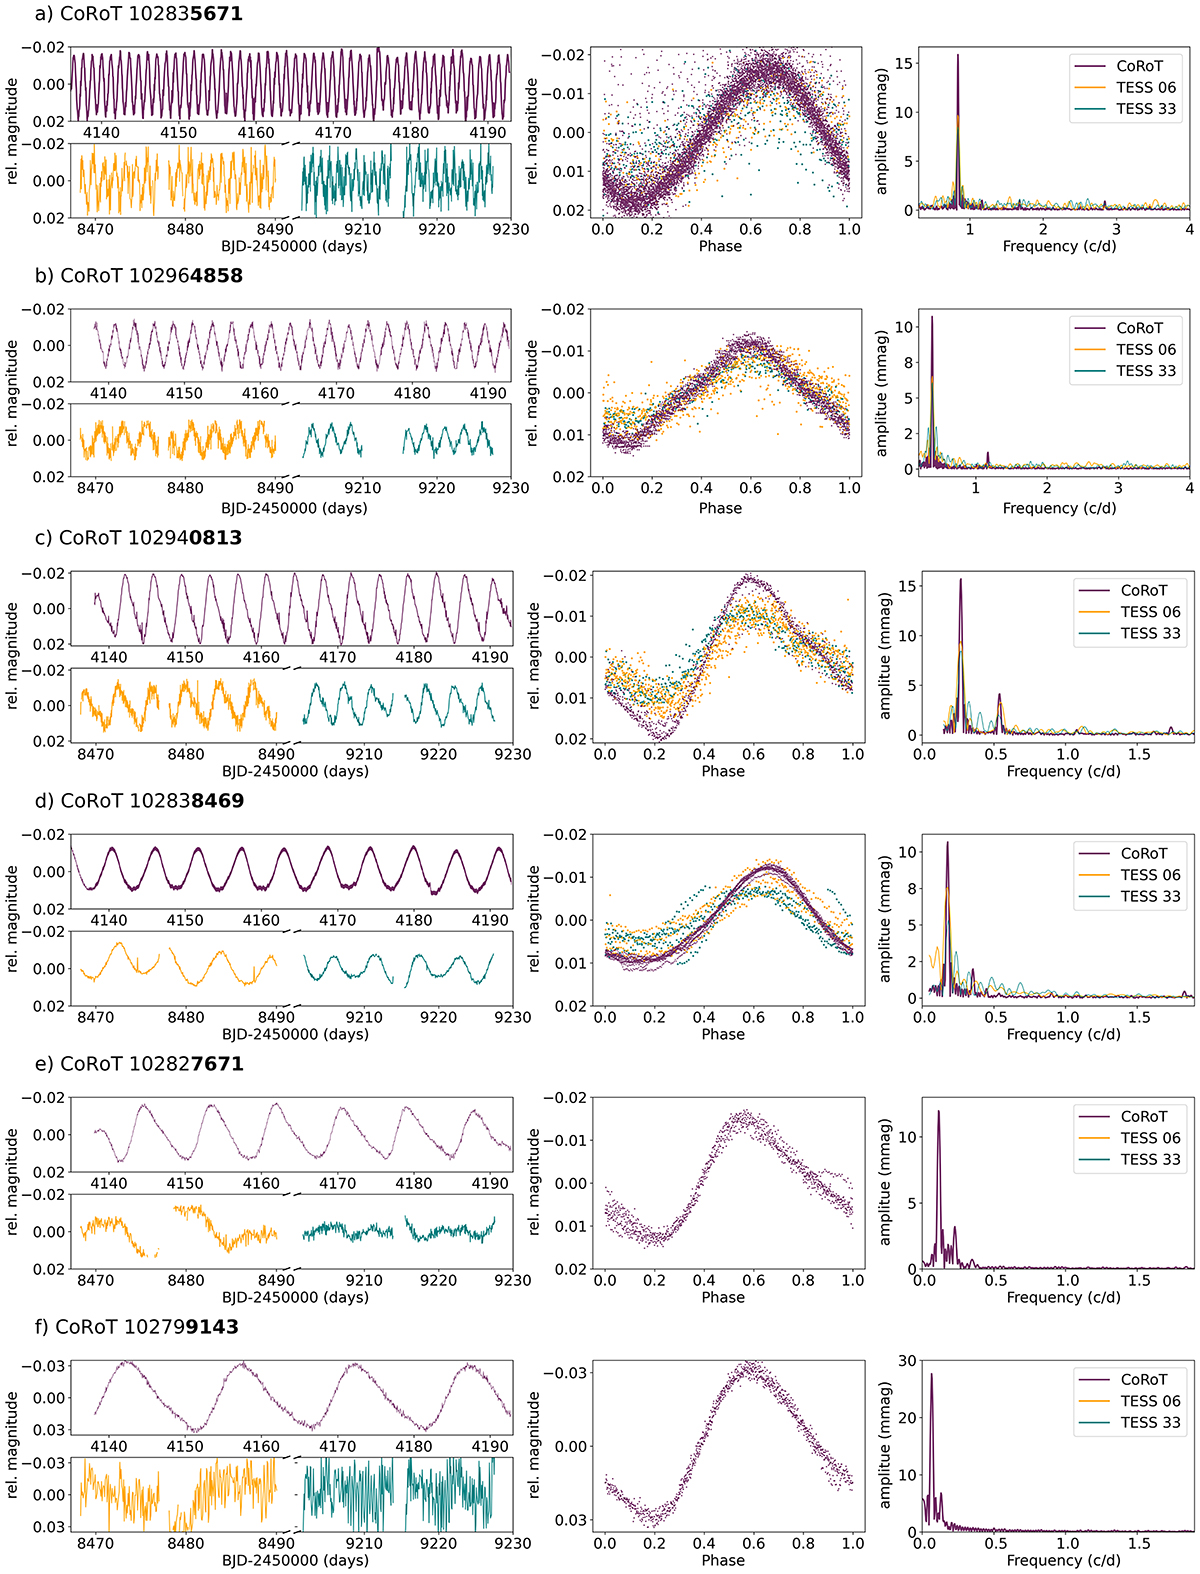
Download original image
CoRoT (purple) and TESS (sectors 6 and 33, marked with orange and teal, respectively) measurement data (left panels) of the six stars. Folded light curves (middle panels) and power spectra (right panels) are plotted with TESS data only for those stars where we could determine their period (panels a–d).
Current usage metrics show cumulative count of Article Views (full-text article views including HTML views, PDF and ePub downloads, according to the available data) and Abstracts Views on Vision4Press platform.
Data correspond to usage on the plateform after 2015. The current usage metrics is available 48-96 hours after online publication and is updated daily on week days.
Initial download of the metrics may take a while.