Open Access
Fig. 8
Download original image
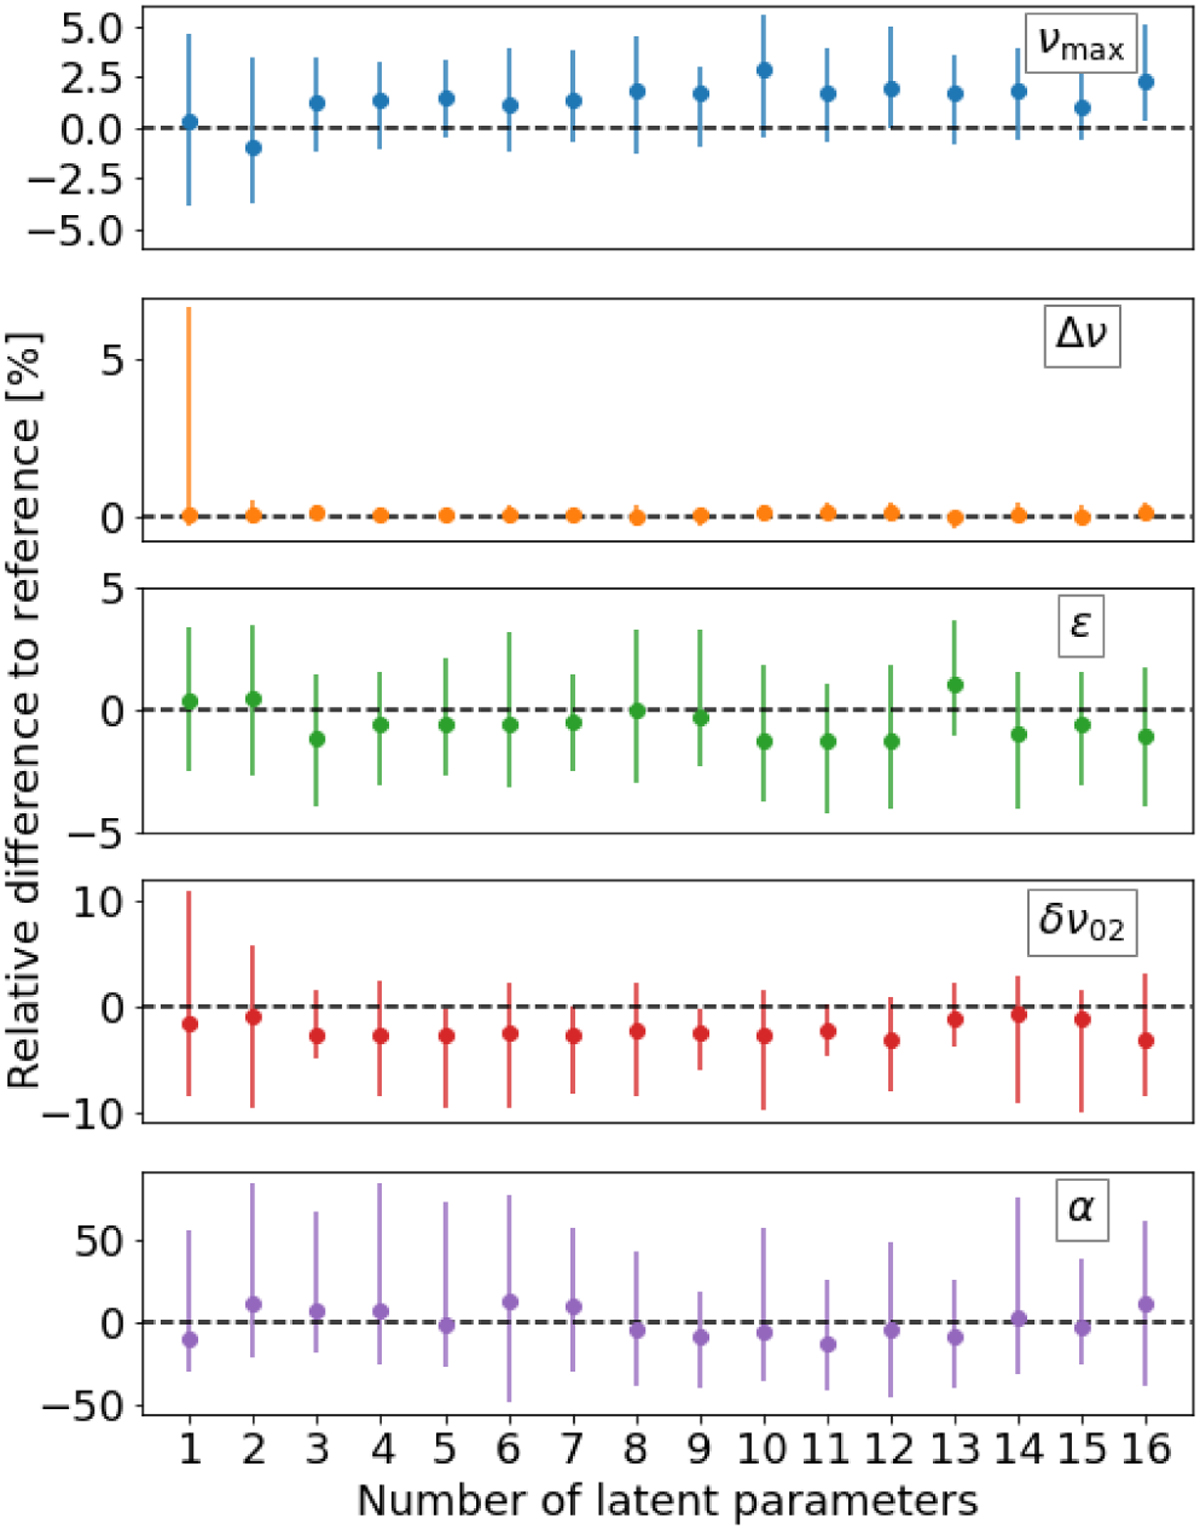
Relative differences of the asymptotic relation parameters determined by PBjam and the PCA method using different numbers of latent parameters. The dashed black lines denote agreement between the two methods. The error bars denote the spread in values for the same sample of 50 stars used in Fig. 7.
Current usage metrics show cumulative count of Article Views (full-text article views including HTML views, PDF and ePub downloads, according to the available data) and Abstracts Views on Vision4Press platform.
Data correspond to usage on the plateform after 2015. The current usage metrics is available 48-96 hours after online publication and is updated daily on week days.
Initial download of the metrics may take a while.