Fig. 7
Download original image
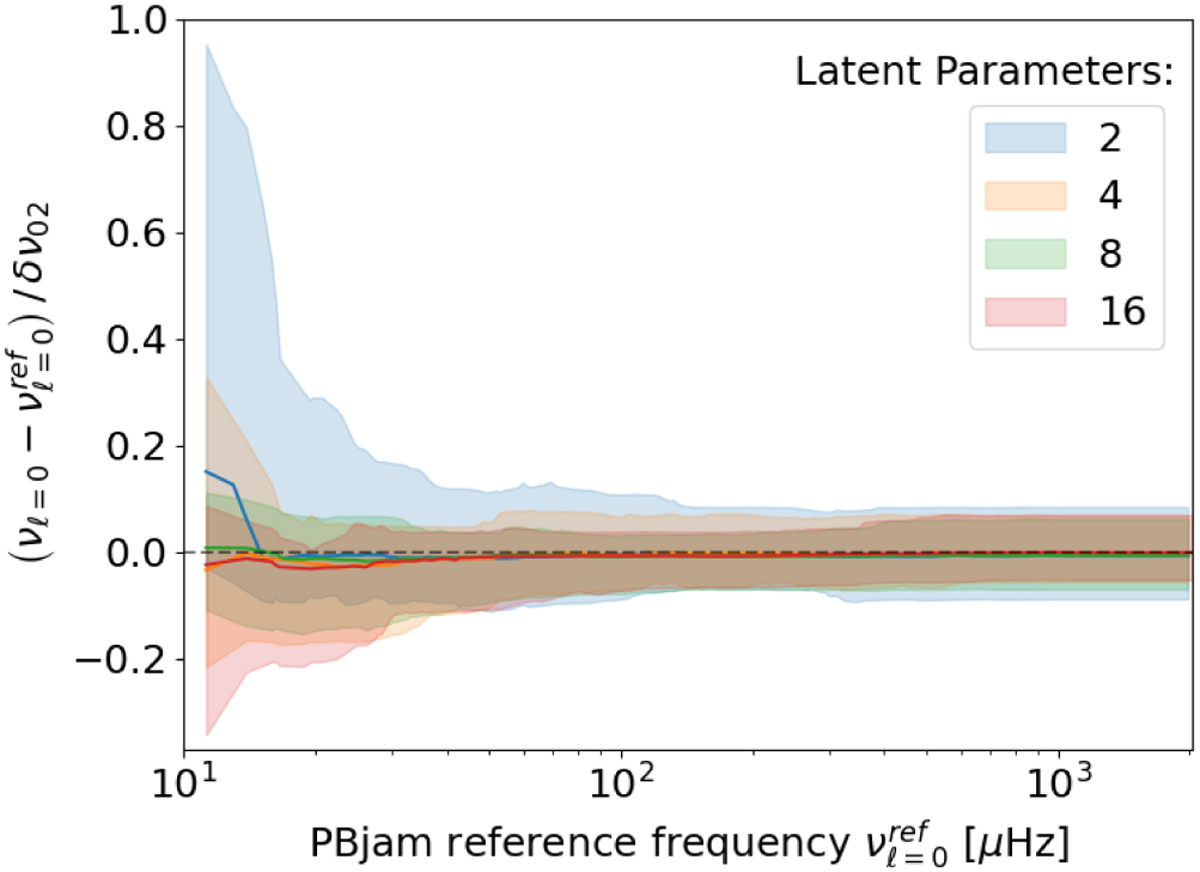
Mode identification precision for a sample of 50 stars using different numbers of latent parameters. The differences between the radial mode frequencies of the PCA method and PBjam are shown in relation to that of δν02 from PBjam. The shaded regions indicate the 68% interval of the observed frequency differences for different numbers of latent parameters used in the model, and the solid colored lines show the median values in each frequency bin. For reference, the dashed line denotes complete agreement between the sets of mode frequencies.
Current usage metrics show cumulative count of Article Views (full-text article views including HTML views, PDF and ePub downloads, according to the available data) and Abstracts Views on Vision4Press platform.
Data correspond to usage on the plateform after 2015. The current usage metrics is available 48-96 hours after online publication and is updated daily on week days.
Initial download of the metrics may take a while.