Fig. 3
Download original image
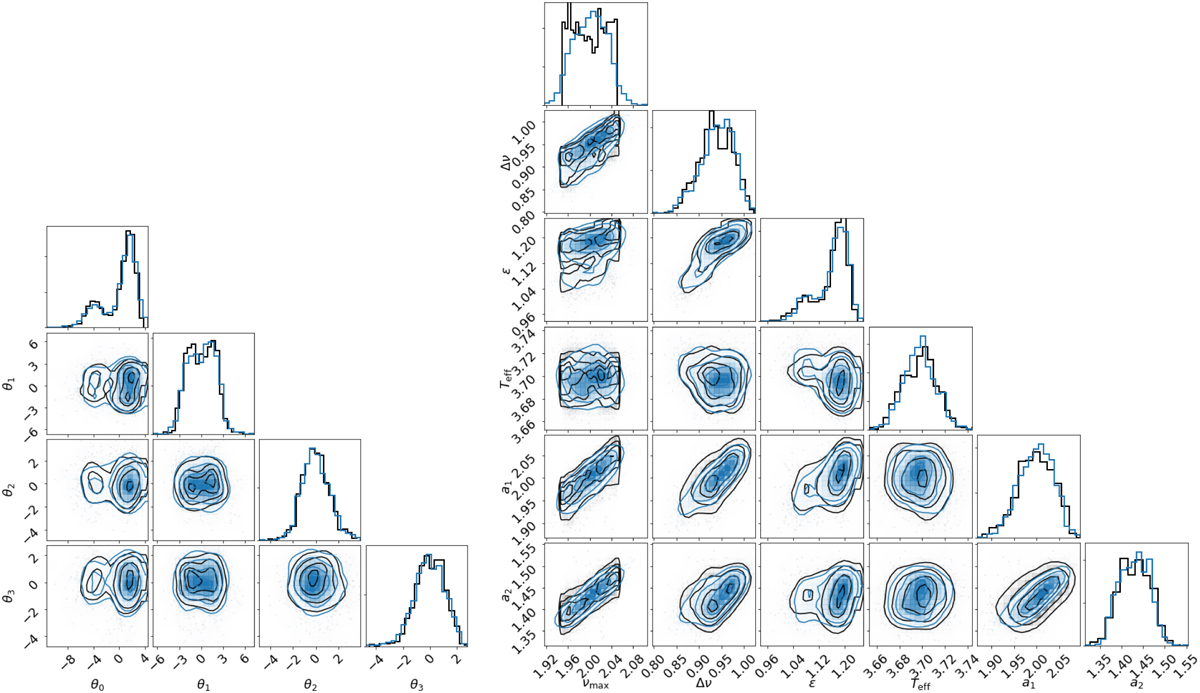
Corner plots of a sample of 400 targets around νmax = 100 μHz drawn from the prior distribution. Left: projection of the sample into the latent parameter space (in black) and a corresponding sample (in blue) drawn from the one-dimensional KDE approximations of the marginalized distributions (diagonal frames). Right: original 400 prior sample draws (in black) with the sample drawn from the latent space, projected into the model parameter space (in blue). For clarity we only show a subset of the model parameters, where all parameters except ε are in base-10 logarithmic units.
Current usage metrics show cumulative count of Article Views (full-text article views including HTML views, PDF and ePub downloads, according to the available data) and Abstracts Views on Vision4Press platform.
Data correspond to usage on the plateform after 2015. The current usage metrics is available 48-96 hours after online publication and is updated daily on week days.
Initial download of the metrics may take a while.