Fig. 1
Download original image
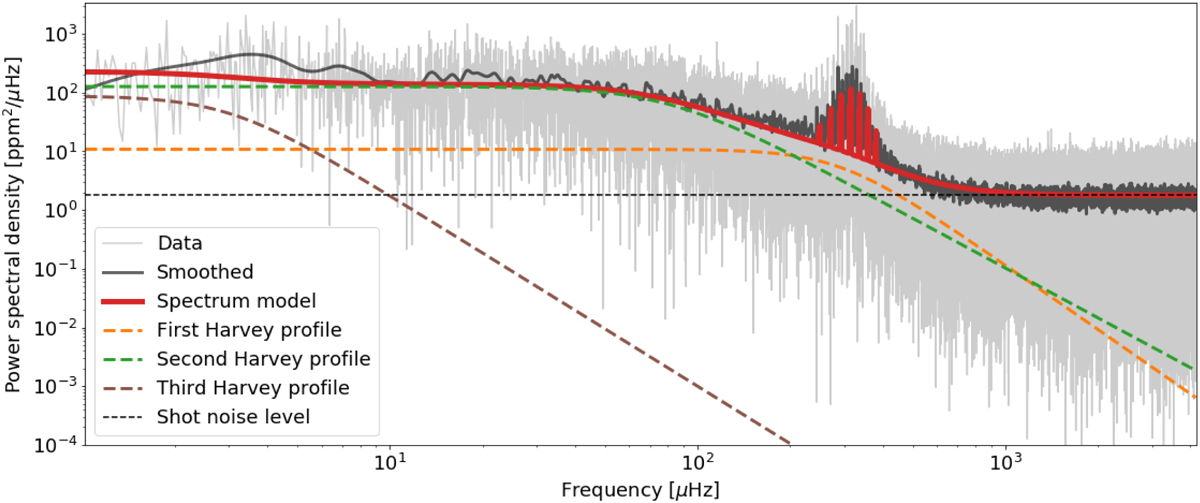
Example spectrum of the red giant ϵ Reticuli. The PSD is shown in light and dark gray (smoothed). The components of the background model are shown with dashed lines, while the combined spectrum model, including the mode components, is shown in red. The parameters of the spectrum model are drawn from the prior sample around νmax ≈ 300 μHz the equivalent to that of ϵ Reticuli.
Current usage metrics show cumulative count of Article Views (full-text article views including HTML views, PDF and ePub downloads, according to the available data) and Abstracts Views on Vision4Press platform.
Data correspond to usage on the plateform after 2015. The current usage metrics is available 48-96 hours after online publication and is updated daily on week days.
Initial download of the metrics may take a while.