Fig. 4
Download original image
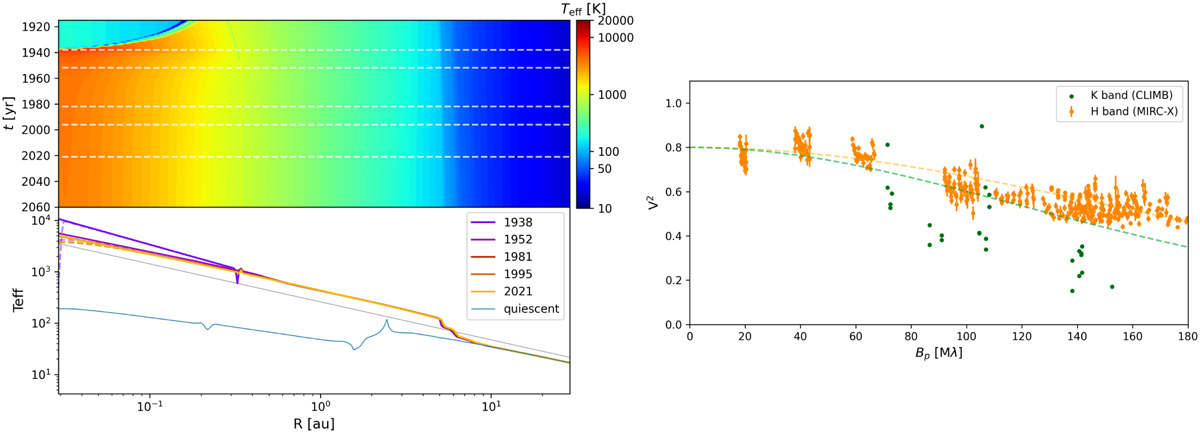
Simulation of an FU Orionis eruption with a 1D MHD layered disk model. Left (upper): temperature profile in time from the 1D model (Simu 1); radial direction in x-axis and time in y-axis. Left (lower): temperature profile produced by the simulation for different epochs (solid colored lines); a T ∝ r−3/4 slope is shown for comparison (solid gray line); the uncorrected profile in the innermost region (~0.01 AU, see text) is shown as a dashed line. Right: spatial morphology of the disk deduced from simulated temperature profile and compared to interferometric observations in H band (1.65 µm) and K band (2.2 µm).
Current usage metrics show cumulative count of Article Views (full-text article views including HTML views, PDF and ePub downloads, according to the available data) and Abstracts Views on Vision4Press platform.
Data correspond to usage on the plateform after 2015. The current usage metrics is available 48-96 hours after online publication and is updated daily on week days.
Initial download of the metrics may take a while.