Fig. 7.
Download original image
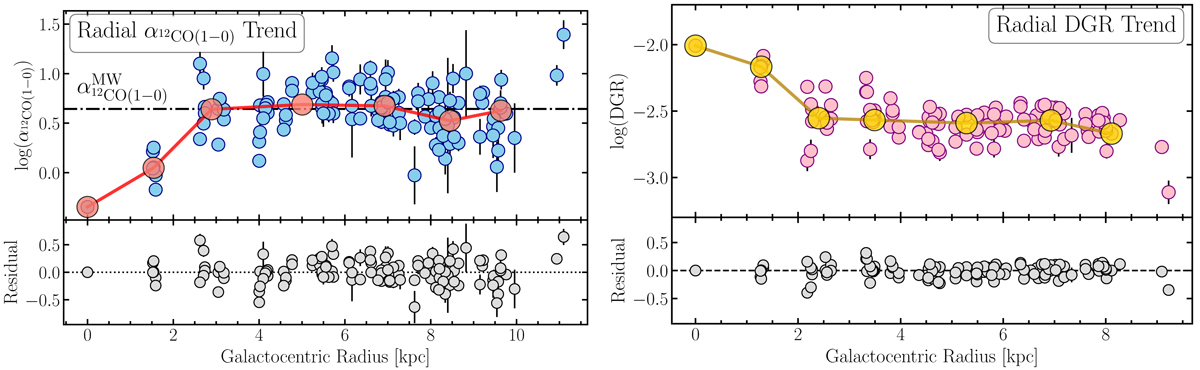
Radial α12CO(1−0) and DGR trend in M101. The left panel shows radial α12CO(1−0) trend, and the right panel illustrates radial DGR dependency. Top: smaller blue (pink) points show the individual α12CO(1−0) (DGR) measurements for the various solution pixels. Larger red (yellow) points show the derived trend based on binning the data. Bottom: residual α12CO(1−0) or DGR values after subtracting the radial trend based on linearly interpolating the binned data trend (solid red /yellow line).
Current usage metrics show cumulative count of Article Views (full-text article views including HTML views, PDF and ePub downloads, according to the available data) and Abstracts Views on Vision4Press platform.
Data correspond to usage on the plateform after 2015. The current usage metrics is available 48-96 hours after online publication and is updated daily on week days.
Initial download of the metrics may take a while.