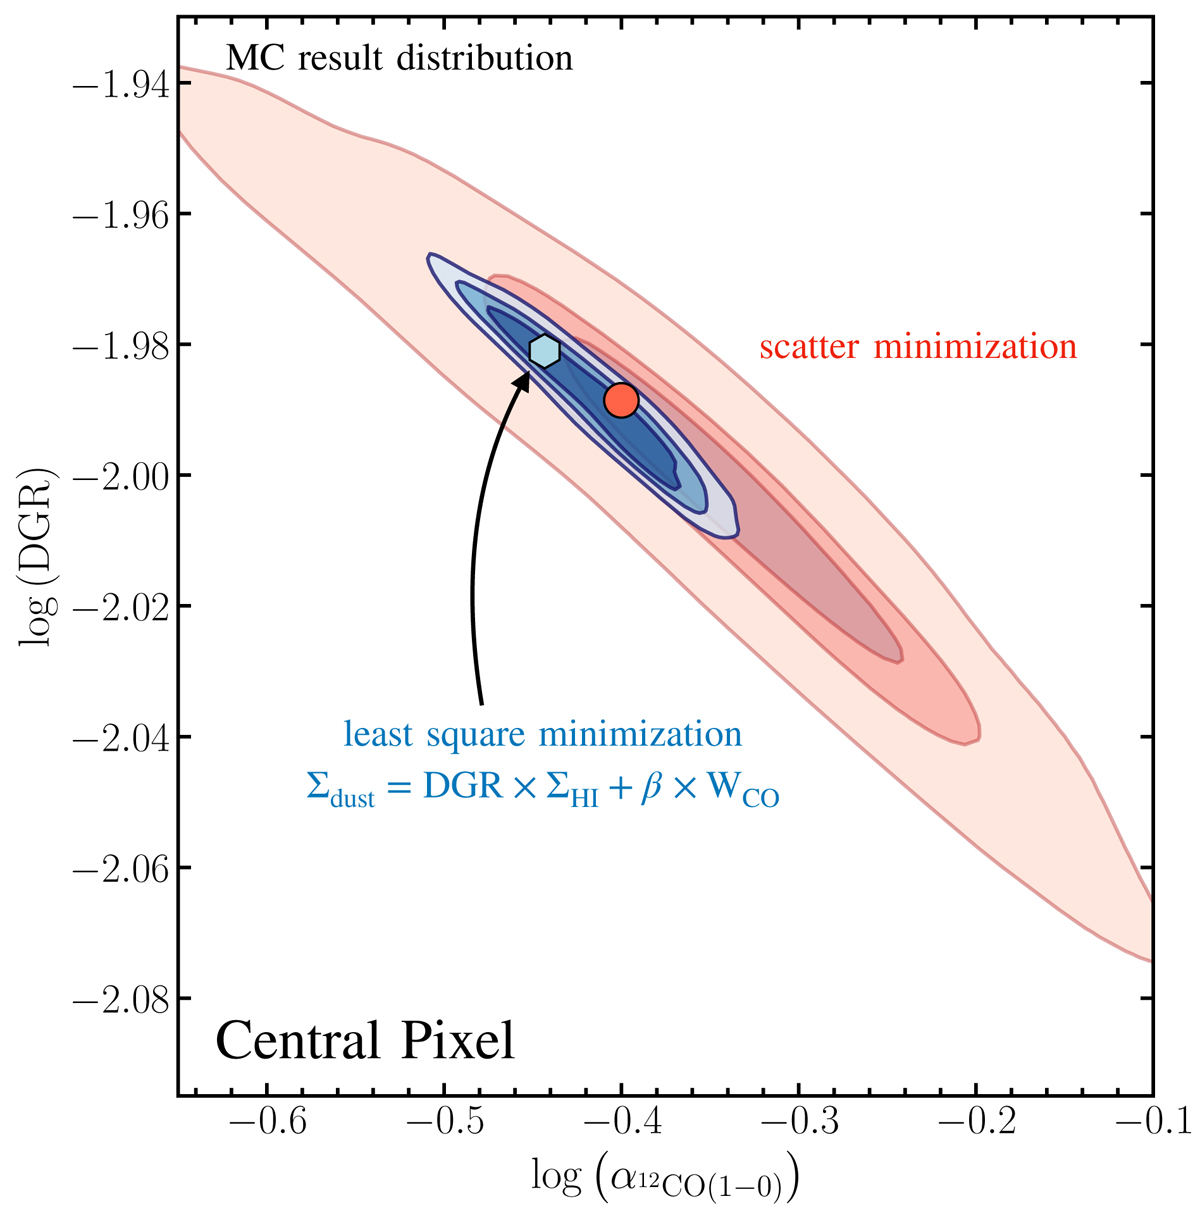
Fig. F.1.
Download original image
MC Simulation for Central Solution Pixel. The red contours show the 10%, 50%, and 75% inclusion of the solution distribution for the scatter minimization technique. Blue shows the result distribution based on the least-square minimization (Eq. ). The red and blue points show the solution before adding noise to the input parameters.
Current usage metrics show cumulative count of Article Views (full-text article views including HTML views, PDF and ePub downloads, according to the available data) and Abstracts Views on Vision4Press platform.
Data correspond to usage on the plateform after 2015. The current usage metrics is available 48-96 hours after online publication and is updated daily on week days.
Initial download of the metrics may take a while.