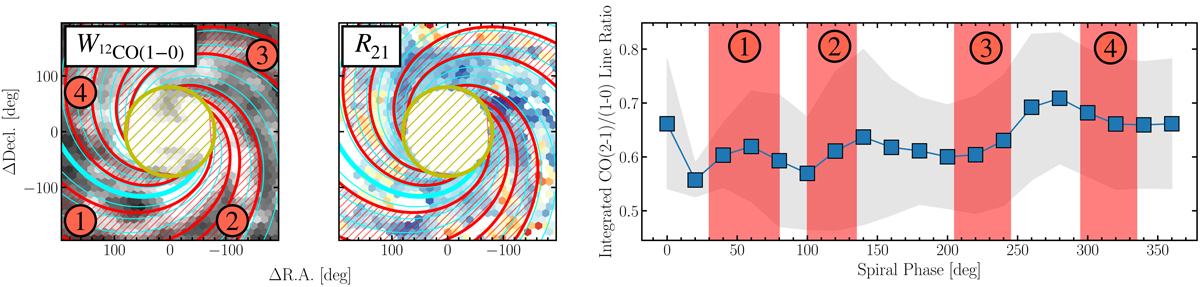
Fig. D.1.
Download original image
Azimuthal Variation of R21 in M101. (Left) The 12CO(1–0) integrated intensity map with the logarithmic spirals with a pitch angle of θ = 23° overlayed. The spirals increment with a spiral phase Δψ = 20° and increment in the counterclockwise direction. The spiral bins have a with of 40°. The thick cyan line indicates ψ = 0. The four spiral arms are accordingly labeled and colored in red. For the spiral binning, we exclude the central 80′ (in diameter), belonging to the central region of the galaxy (indicated by the golden-hatched region in the middle). (Center) The map shows the R21 variation across the galaxy. Spiral bins follow the description on the left panel. (Right) The line ratio is binned by the spiral phase. The gray-shaded region shows the 1σ scatter per bin. The red-shaded region indicates the spiral phases of a particular spiral arm.
Current usage metrics show cumulative count of Article Views (full-text article views including HTML views, PDF and ePub downloads, according to the available data) and Abstracts Views on Vision4Press platform.
Data correspond to usage on the plateform after 2015. The current usage metrics is available 48-96 hours after online publication and is updated daily on week days.
Initial download of the metrics may take a while.