Fig. 15.
Download original image
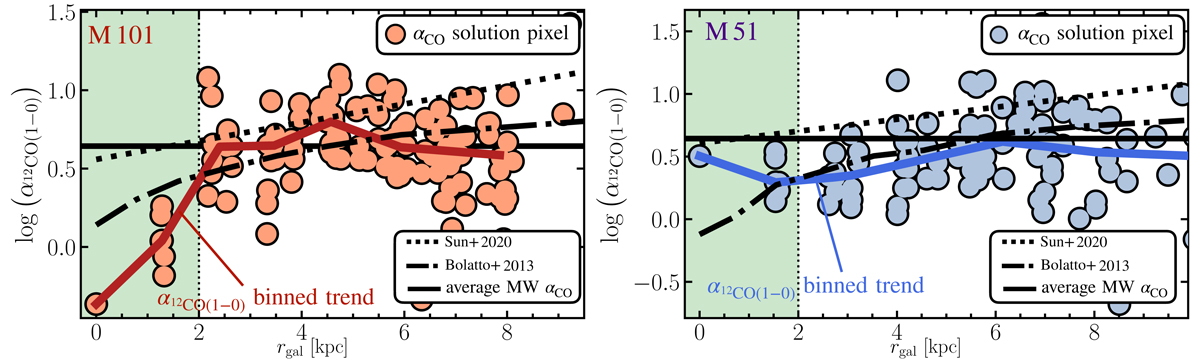
CO(1–0)-to-H2 conversion factor prescription comparison Comparing the radial α12CO(1−0) trend derived from binning the data (in color) and the trend derived from applying different prescriptions. The trend for M101 is shown in the left and for M51 on the right. Comparison of the derived trend when applying the α12CO(1−0) prescription used Sun et al. (2022; dotted line), from Bolatto et al. (2013; dash-dotted line). The black horizontal line illustrates the average local solar neighborhood α12CO(1−0) value. The green-shaded region is an approximate illustration of the central region of the galaxy, where conditions potentially change dramatically to the overall disk.
Current usage metrics show cumulative count of Article Views (full-text article views including HTML views, PDF and ePub downloads, according to the available data) and Abstracts Views on Vision4Press platform.
Data correspond to usage on the plateform after 2015. The current usage metrics is available 48-96 hours after online publication and is updated daily on week days.
Initial download of the metrics may take a while.