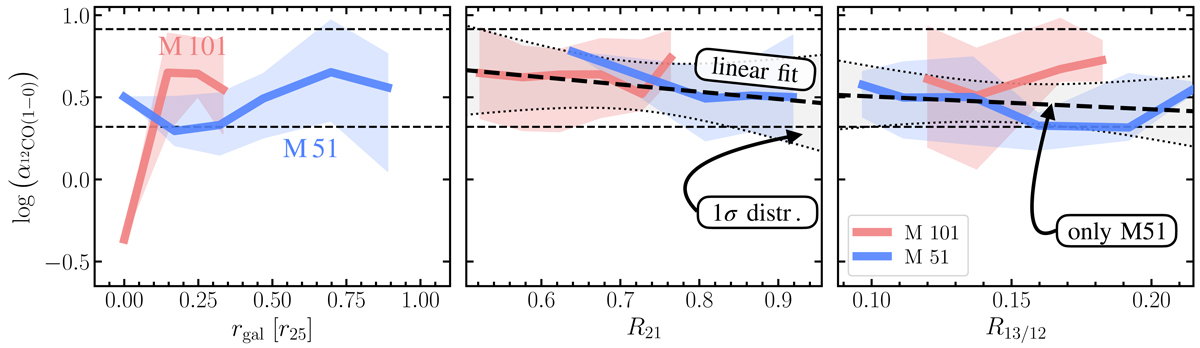
Fig. 10.
Download original image
Comparing α12CO(1−0) trends in M101 and M51. Comparison of radial α12CO(1−0) trend in M101(red) and M51(blue). Each panel shows the trend line for both galaxies separately. The trend is determined by binning the α12CO(1−0) values of the individual line of sights. The two dashed lines show the 16th and 84th percentile distribution of the combined M51 and M101 α12CO(1−0) dataset. The shaded region around the trend line shows the respective 1σ scatter of the respective trend line fit. Left: the trend of α12CO(1−0) with galactocentric radius normalized by r25. Center: 12CO line ratio R21 correlation. The thick-dashed line shows a linear regression to the stacked data points (combining M51 and M101). The grey-shaded region between the dotted curves indicates the 1σ confidence interval of the fit. Right: trend with the 13CO-to-12CO line ratio, R13/12. The linear regression only fits the trend for M51 since no clear trend is seen for M101.
Current usage metrics show cumulative count of Article Views (full-text article views including HTML views, PDF and ePub downloads, according to the available data) and Abstracts Views on Vision4Press platform.
Data correspond to usage on the plateform after 2015. The current usage metrics is available 48-96 hours after online publication and is updated daily on week days.
Initial download of the metrics may take a while.