Fig. 9
Download original image
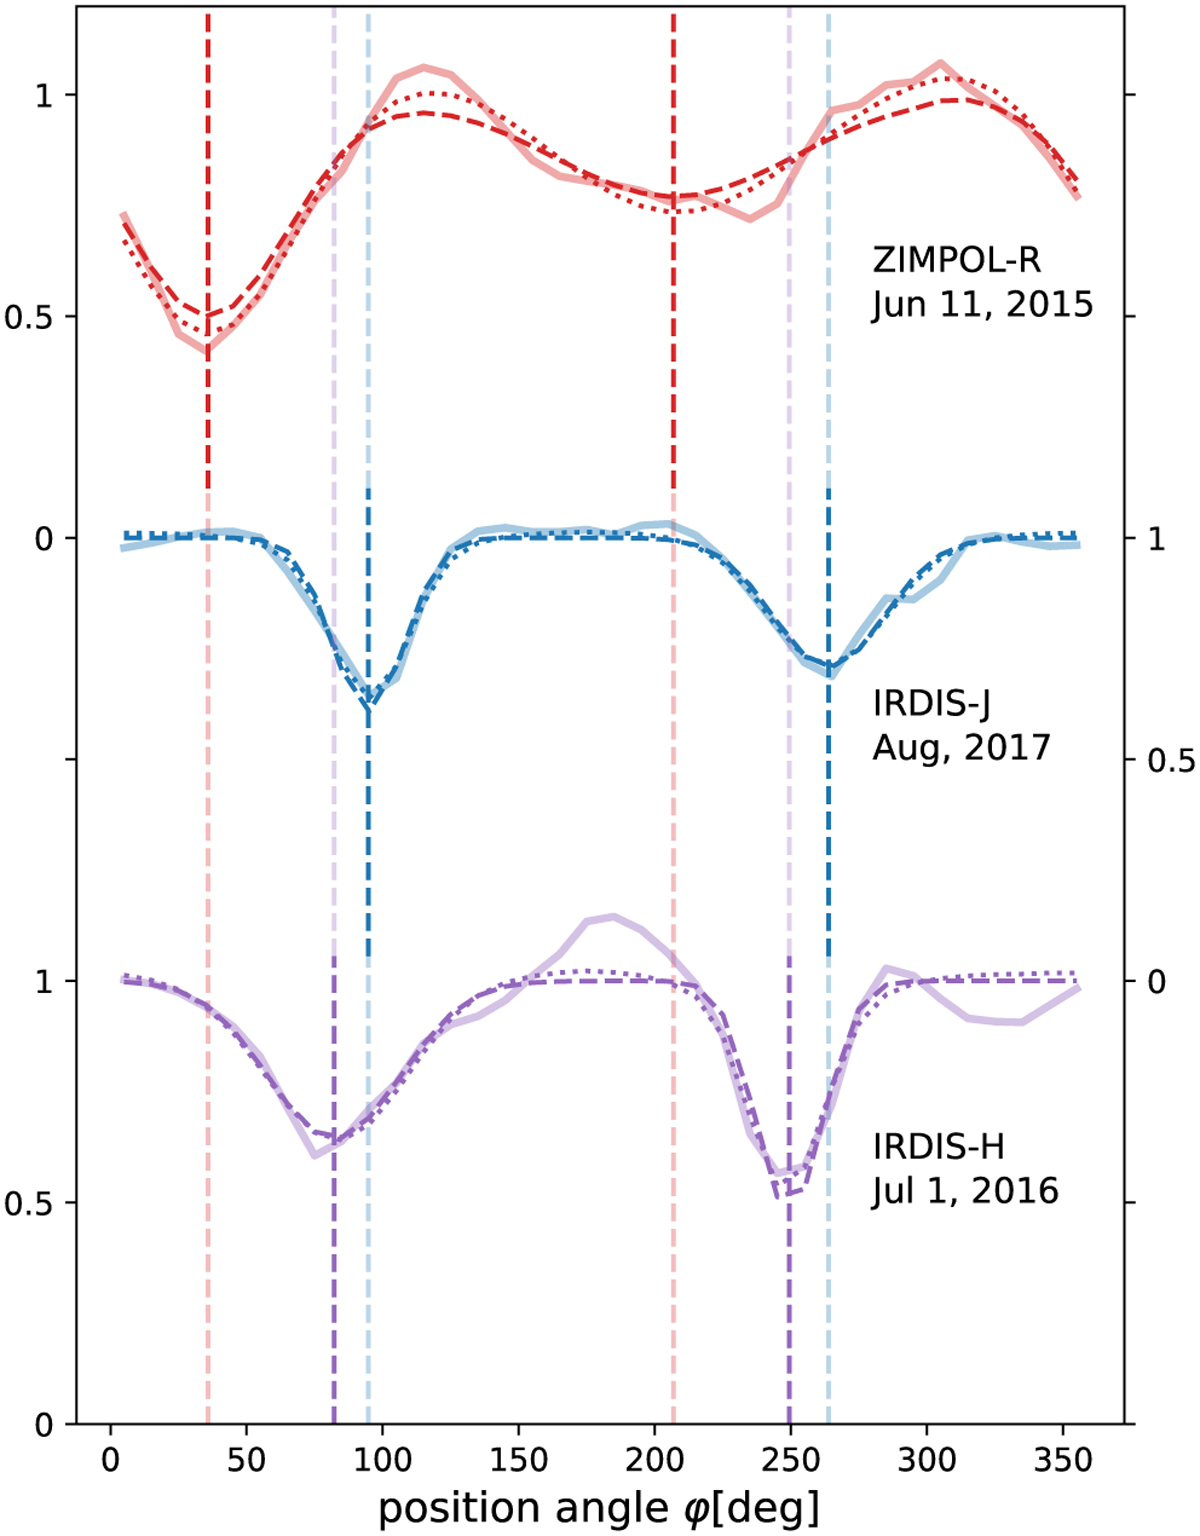
Observations (full line with light colors), fit (dotted lines), and convolved fit (dashed lines) of the azimuthal dependence of the polarized intensity, A(ϕ)/A0, for RX J1604. The curves give means of the R band epoch (top), of the five selected epochs for the J band (middle), and the epoch of the H band observations (bottom). The R band profiles might be affected by polarimetric calibration errors (see Appendix A.4).
Current usage metrics show cumulative count of Article Views (full-text article views including HTML views, PDF and ePub downloads, according to the available data) and Abstracts Views on Vision4Press platform.
Data correspond to usage on the plateform after 2015. The current usage metrics is available 48-96 hours after online publication and is updated daily on week days.
Initial download of the metrics may take a while.