Fig. 8
Download original image
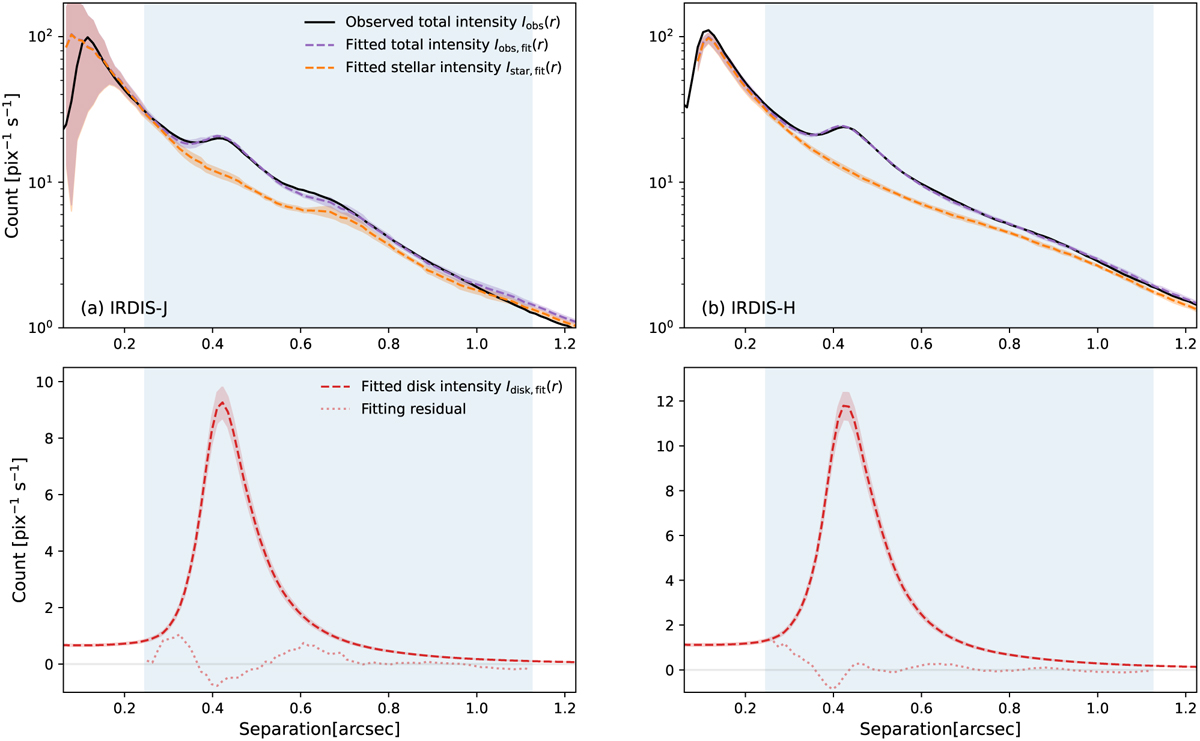
Fitting result for the azimuthally averaged radial profile of disk intensity. Columns a and b are for the IRDIS-J and IRDIS-H band, respectively. Top panel: radial profiles in logarithmic scale of the observed total intensity, Iobs(r), in black, the fitted total intensity, Iobs,fit(r), in purple, and the fitted stellar intensity, Istar,fit(r), in orange. Lower panel: radial profiles of fitted disk intensity, Idisk,fit(r), in red and the fitting residual in brown.
Current usage metrics show cumulative count of Article Views (full-text article views including HTML views, PDF and ePub downloads, according to the available data) and Abstracts Views on Vision4Press platform.
Data correspond to usage on the plateform after 2015. The current usage metrics is available 48-96 hours after online publication and is updated daily on week days.
Initial download of the metrics may take a while.