Fig. 5.
Download original image
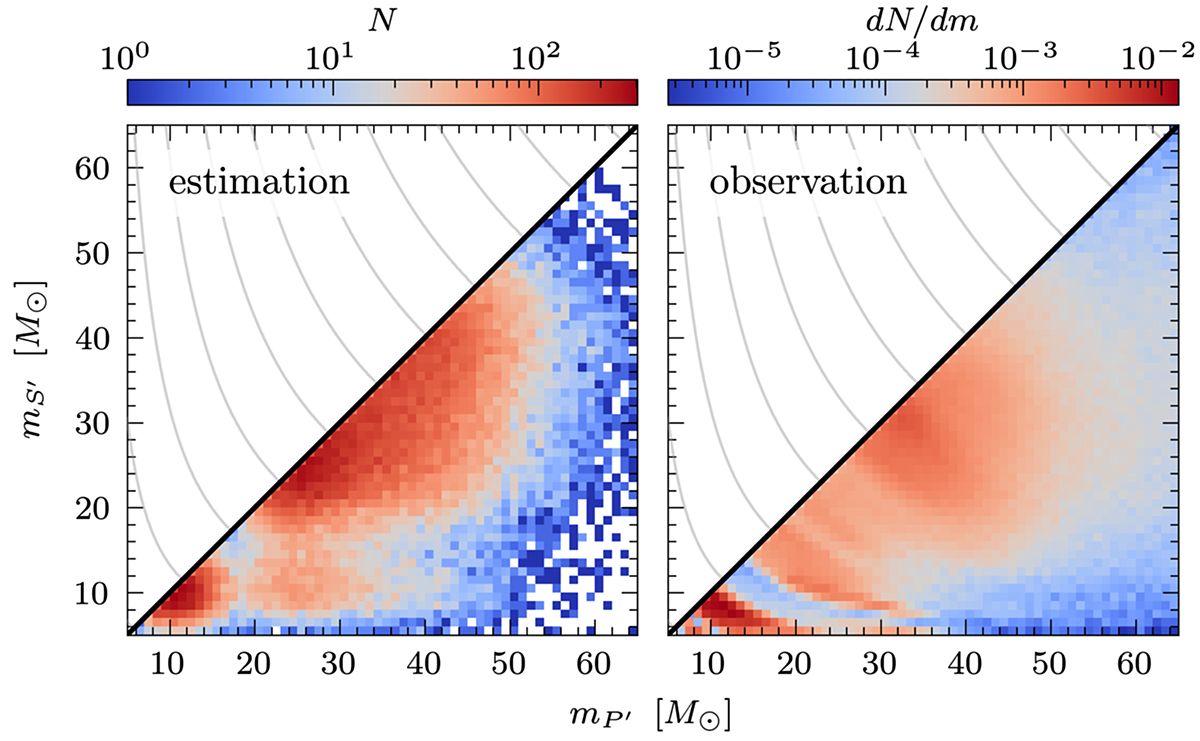
Primary versus secondary mass distributions, for the results of our estimation (left) and the GW data (right), both in 2D histograms with a bin-width of 1 M⊙. Left panel shows the same as the upper right panel from Fig. 4. We use the notation P′ and S′ here to denote the stars with the largest and smallest final masses, respectively, in contrast to P and S from Fig. 4, which concern the initial masses. The right panel shows the cosmologically reweighted posterior distributions of the GW data (LIGO Scientific Collaboration & Virgo Collaboration 2021; LIGO Scientific Collaboration, Virgo Collaboration, & KAGRACollaboration 2021). Since the posteriors are not normalized, we rescaled them to ![]() . Then, after adding all the posteriors, we normalized the resulting distribution in between 5 M⊙ and 65 M⊙. We omit GW200322 here, since no valid posterior for this source has been given. The grey lines are lines of equal chirp mass, with intervals of 5 M⊙.
. Then, after adding all the posteriors, we normalized the resulting distribution in between 5 M⊙ and 65 M⊙. We omit GW200322 here, since no valid posterior for this source has been given. The grey lines are lines of equal chirp mass, with intervals of 5 M⊙.
Current usage metrics show cumulative count of Article Views (full-text article views including HTML views, PDF and ePub downloads, according to the available data) and Abstracts Views on Vision4Press platform.
Data correspond to usage on the plateform after 2015. The current usage metrics is available 48-96 hours after online publication and is updated daily on week days.
Initial download of the metrics may take a while.