Fig. 3.
Download original image
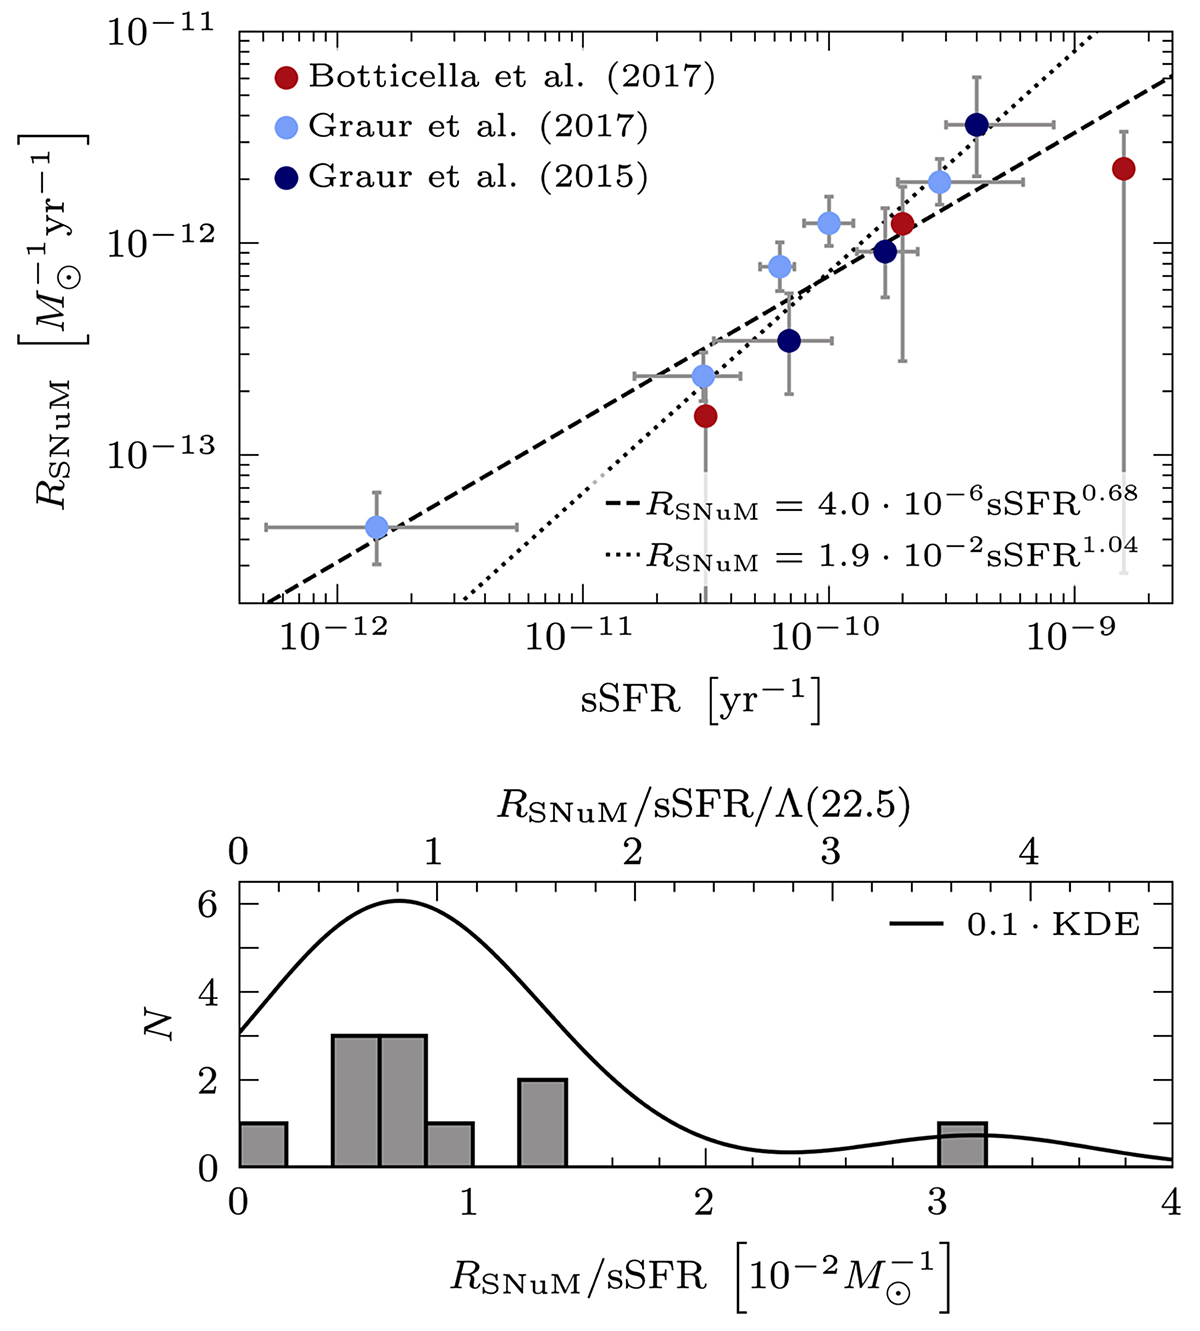
Data from SN surveys (Graur et al. 2015, 2017; Botticella et al. 2017). Top panel: Type II SN rates per unit mass (RSNuM) versus the SFR per unit mass (sSFR), together with a fit for all the data-points (dashed line) and a fit which excludes the two outliers at sSFR ≈ 1.5 × 10⁻¹² yr−1 and 1.5 × 10⁻⁹ yr−1 (dotted line). The fits use the least-squares method on a first degree polynomial in logarithmic space and the error bars are one standard deviation. These data are corrected for the Chabrier (2003) IMF, since the original data follows the Salpeter (1955) IMF. For a constant SFR, L = κψ∫τϕL(m)dm, where L(m)∝m3.5 is the luminosity of a star with mass m. However, since τ(m)⋅L(m)∝m, it cancels out with κ and makes the SFR independent of the IMF. Since the SN rate is proportional to κ, it is multiplied by a factor κChabrier/κSalpeter ≈ 1.38, this correction therefore also multiplies RSNuM/sSFR by a factor of 1.38. The bottom panel shows a histogram of the RSNuM/sSFR ratio (with a bin-width of ![]() ), and a kernel density estimation (KDE).
), and a kernel density estimation (KDE).
Current usage metrics show cumulative count of Article Views (full-text article views including HTML views, PDF and ePub downloads, according to the available data) and Abstracts Views on Vision4Press platform.
Data correspond to usage on the plateform after 2015. The current usage metrics is available 48-96 hours after online publication and is updated daily on week days.
Initial download of the metrics may take a while.