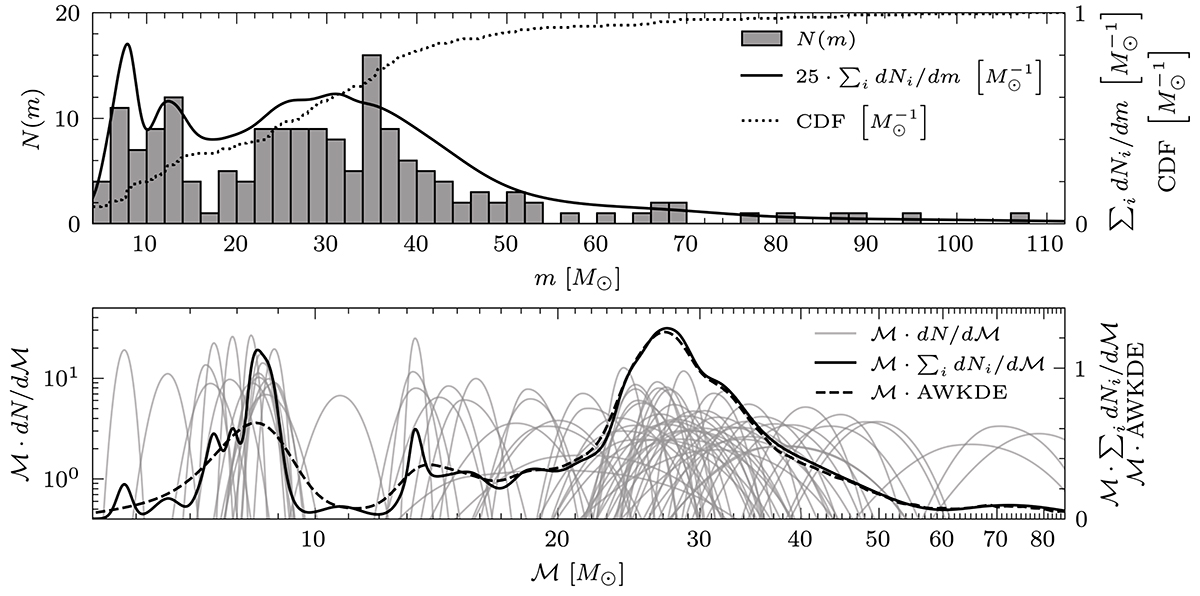
Fig. 1.
Download original image
GW data from Abbott et al. (2021b). Top panel: mass distribution of the individual BBHs (represented by a histogram of the mean values, with a bin-width of 2 M⊙). We can also represent the datapoints as asymmetric Gaussians, as described in Appendix A. The sum of these Gaussians, ∑idNi/dm, is given as well (solid line), together with a cumulative distribution function (CDF, dotted line on a different axis). Bottom panel: chirp mass distribution (grey lines), which is made to resemble the distribution from Abbott et al. (2023). In order to do this, we use asymmetric Gaussians as well, taking into account the 90% credible interval. We also show an adjustable-width kernel density estimation (AWKDE, dashed line) from Shimazaki & Shinomoto (2010), Shimazaki et al. (2018). The Gaussians are plotted on a logarithmic axis, while the sum and the AWKDE use a linear axis. Similarly to Abbott et al. (2023), we omitted GW190814 from our analysis.
Current usage metrics show cumulative count of Article Views (full-text article views including HTML views, PDF and ePub downloads, according to the available data) and Abstracts Views on Vision4Press platform.
Data correspond to usage on the plateform after 2015. The current usage metrics is available 48-96 hours after online publication and is updated daily on week days.
Initial download of the metrics may take a while.