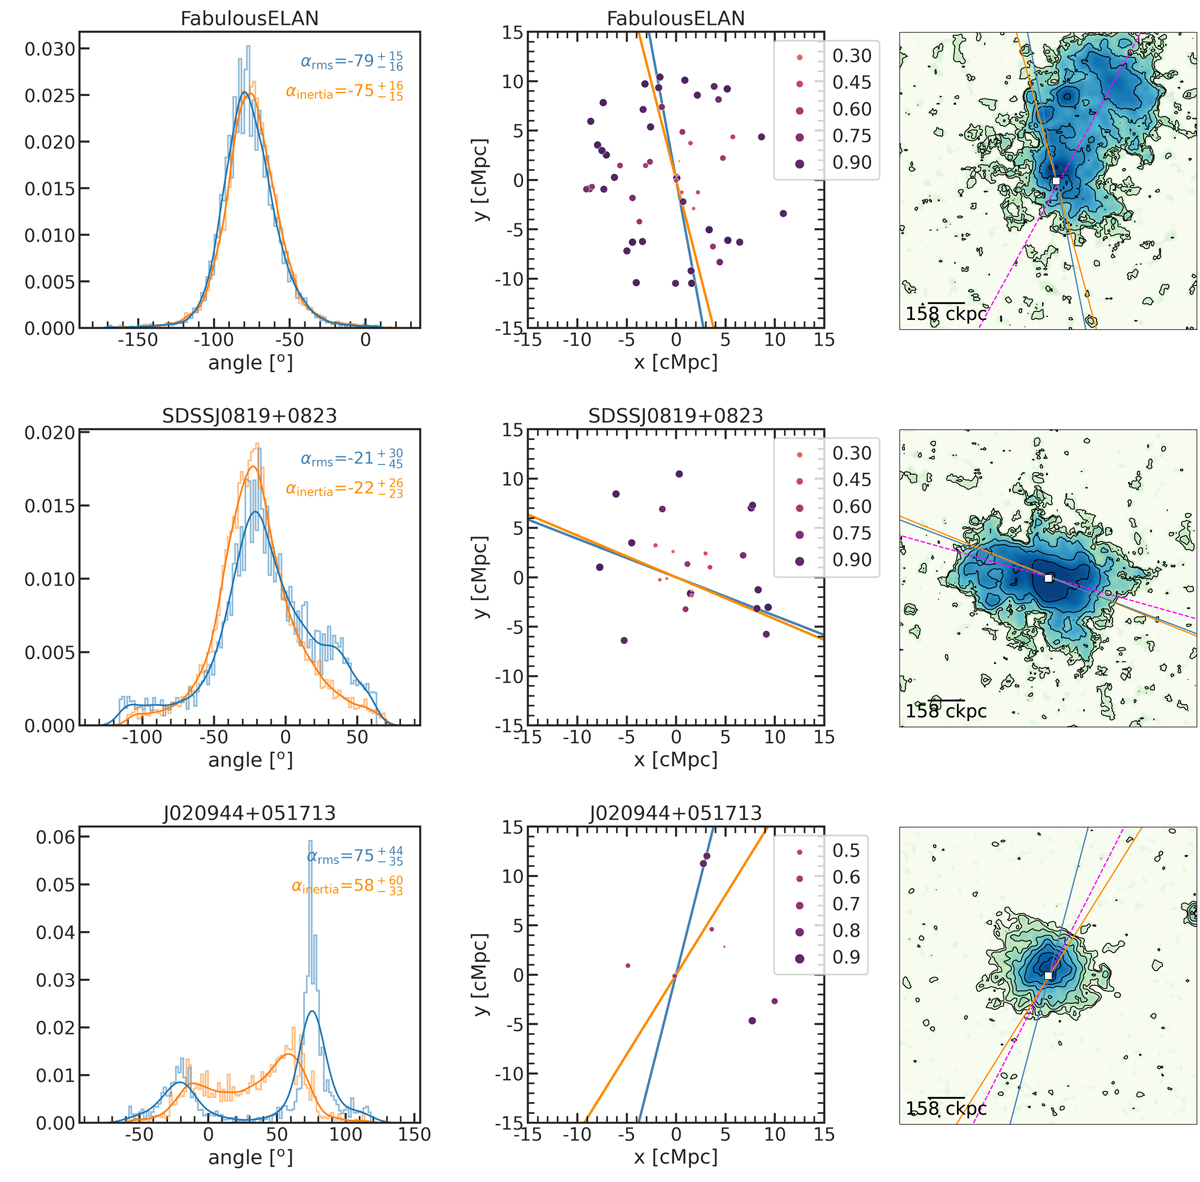
Fig. 9.
Download original image
Density distribution functions for the direction of the overdensity (left), source distributions with the direction of the overdensity overlaid (center), and Lyα SB maps (right) with the direction of the overdensity and the Lyα major axis overlaid (magenta). In each plot, the direction of the overdensity is color-coded in blue or orange depending on the method used, rms or inertia tensor, respectively (see Sect. 6.2). We show these plots for one ELAN (Fabulous) and for the two quasar fields with the largest (SDSSJ0819+0823) and smallest (J020944+051713) overdensity factor in our sample. In the central panels, the source sizes and colors indicate their completeness, which is used as a weight in the calculation of the direction of the overdensity. The Lyα SB maps are shown with a logarithmic color scheme stretching from 10−19 to 5 × 10⁻¹⁷ erg s cm−2 arcsec−2, and with contours at S/N = 2, 4, 10, 20, and 50. We stress that the Lyα maps are on much smaller scales (see their scale bars) than the 850 μm detections in the central panels.
Current usage metrics show cumulative count of Article Views (full-text article views including HTML views, PDF and ePub downloads, according to the available data) and Abstracts Views on Vision4Press platform.
Data correspond to usage on the plateform after 2015. The current usage metrics is available 48-96 hours after online publication and is updated daily on week days.
Initial download of the metrics may take a while.