Fig. 5.
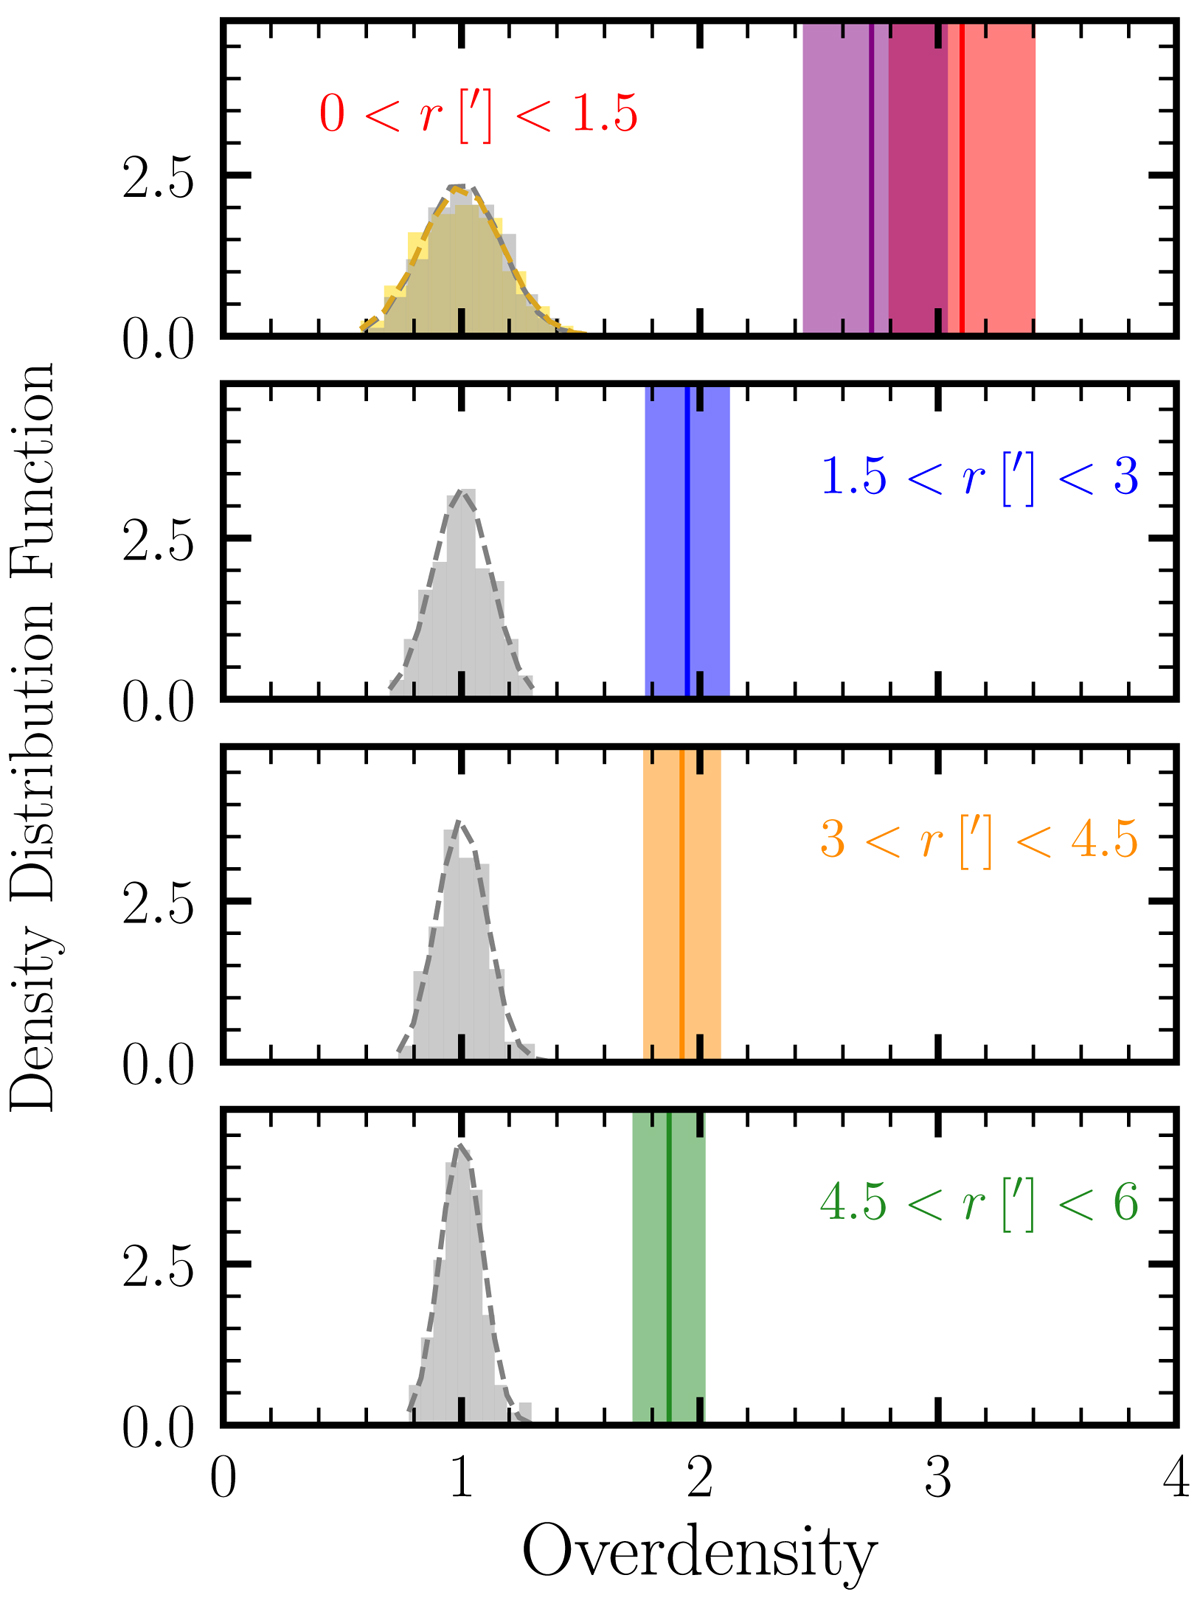
Download original image
Overdensities of detected sources with S/N > 4 in different apertures in arcminutes (colored vertical lines) compared to the density distribution functions of overdensities from 500 realizations of 20 mock blank fields with similar noise properties as the 20 science maps, each divided by their mean value (gray distributions). The overdensity in each aperture is detected at a high significance, with the strength of the overdensity decreasing from the central to the outer aperture (see Table 5). The errors on overdensities take into account the Poisson uncertainties on the counts. The significance of the overdensities also taking the Gaussian “background” into account is given in Table 5.
Current usage metrics show cumulative count of Article Views (full-text article views including HTML views, PDF and ePub downloads, according to the available data) and Abstracts Views on Vision4Press platform.
Data correspond to usage on the plateform after 2015. The current usage metrics is available 48-96 hours after online publication and is updated daily on week days.
Initial download of the metrics may take a while.