Fig. 4.
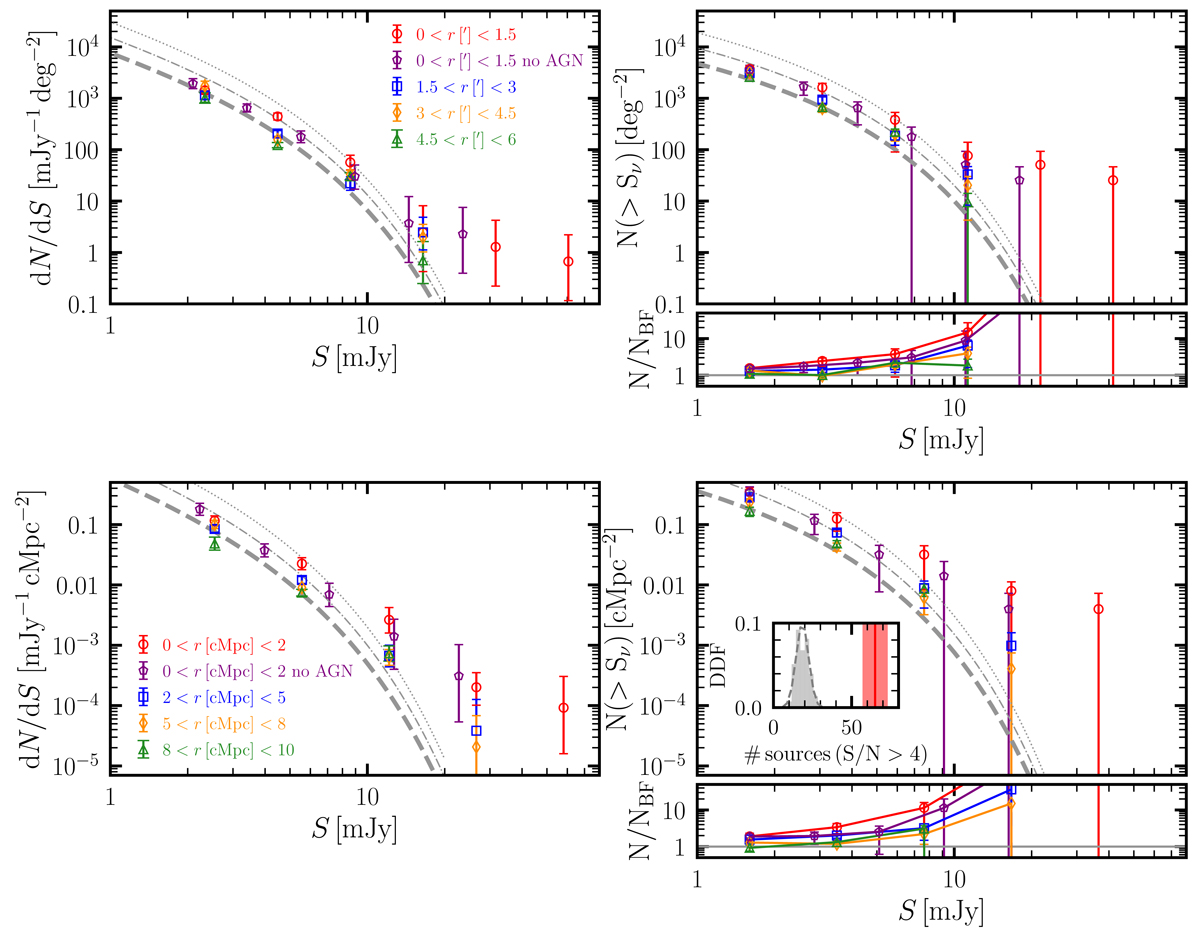
Download original image
Differential and cumulative number counts obtained in apertures. Top: comparison of the differential (left panel) and cumulative (right panel) number counts obtained in apertures (in arcminutes; see the legend and Sect. 5.2) around the targeted systems with respect to an estimate for blank fields (dashed gray; Geach et al. 2017). The dot-dashed and dotted lines show models with the same γ and S0, but with 2× and 4× higher normalization (N0), respectively. The panel in the bottom-right corner shows the ratio between the number of sources for each aperture and the reference blank field model. For a better visualization of the data points at low fluxes, this plot is cut at a ratio of 50, and therefore it does not show the uncertain data points at large fluxes, which by far exceed the blank field model. A trend of decreasing overdensity from the inner to the outer aperture is evident. Bottom: similar to the top panel, but for the differential number counts obtained in apertures defined in comoving megaparsecs (see the legend and Sect. 5.2) around the targeted systems with respect to an estimate for blank fields (dashed gray; Geach et al. 2017), but translated to comoving megaparsecs for the median redshift of our sample. The inset plot compares the number of detected sources with S/N > 4 for the inner bin with the density distribution function obtained from 500 realizations of 20 mock blank fields, similar to what is done in Fig. 5 with apertures in arcminutes.
Current usage metrics show cumulative count of Article Views (full-text article views including HTML views, PDF and ePub downloads, according to the available data) and Abstracts Views on Vision4Press platform.
Data correspond to usage on the plateform after 2015. The current usage metrics is available 48-96 hours after online publication and is updated daily on week days.
Initial download of the metrics may take a while.