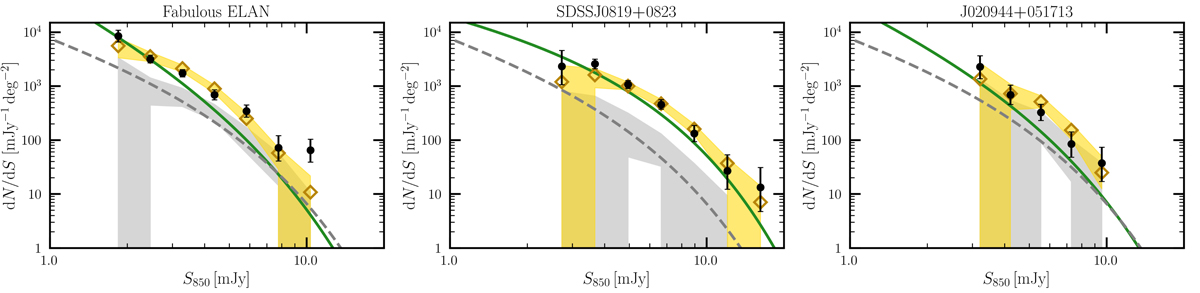
Fig. 3.
Download original image
Differential number counts recovered from 500 realizations of the underlying number count models determined through Monte Carlo simulations (yellow) and the fiducial model (gray) for three example fields: one ELAN (Fabulous) and two quasar fields, the ones with the largest (SDSSJ 0819+0823) and smallest (J020944+051713) overdensity factors in our sample. The shaded regions represent the 90% confidence intervals of the counts recovered from the simulated maps. The black points are raw differential number counts as defined in Sect. 4. The underlying count models and the fiducial model (Geach et al. 2017) are plotted in green and dashed gray, respectively. The effect of flux boosting can be observed as the shaded regions are lying above their input model. Note that the lower zero limits of the fiducial model realizations at faint fluxes reflect the nonuniform noise structure of our maps, where incompleteness increases with distance from the center of the map. Similar plots for all the other fields are shown in Appendix G.
Current usage metrics show cumulative count of Article Views (full-text article views including HTML views, PDF and ePub downloads, according to the available data) and Abstracts Views on Vision4Press platform.
Data correspond to usage on the plateform after 2015. The current usage metrics is available 48-96 hours after online publication and is updated daily on week days.
Initial download of the metrics may take a while.