Fig. 2.
Download original image
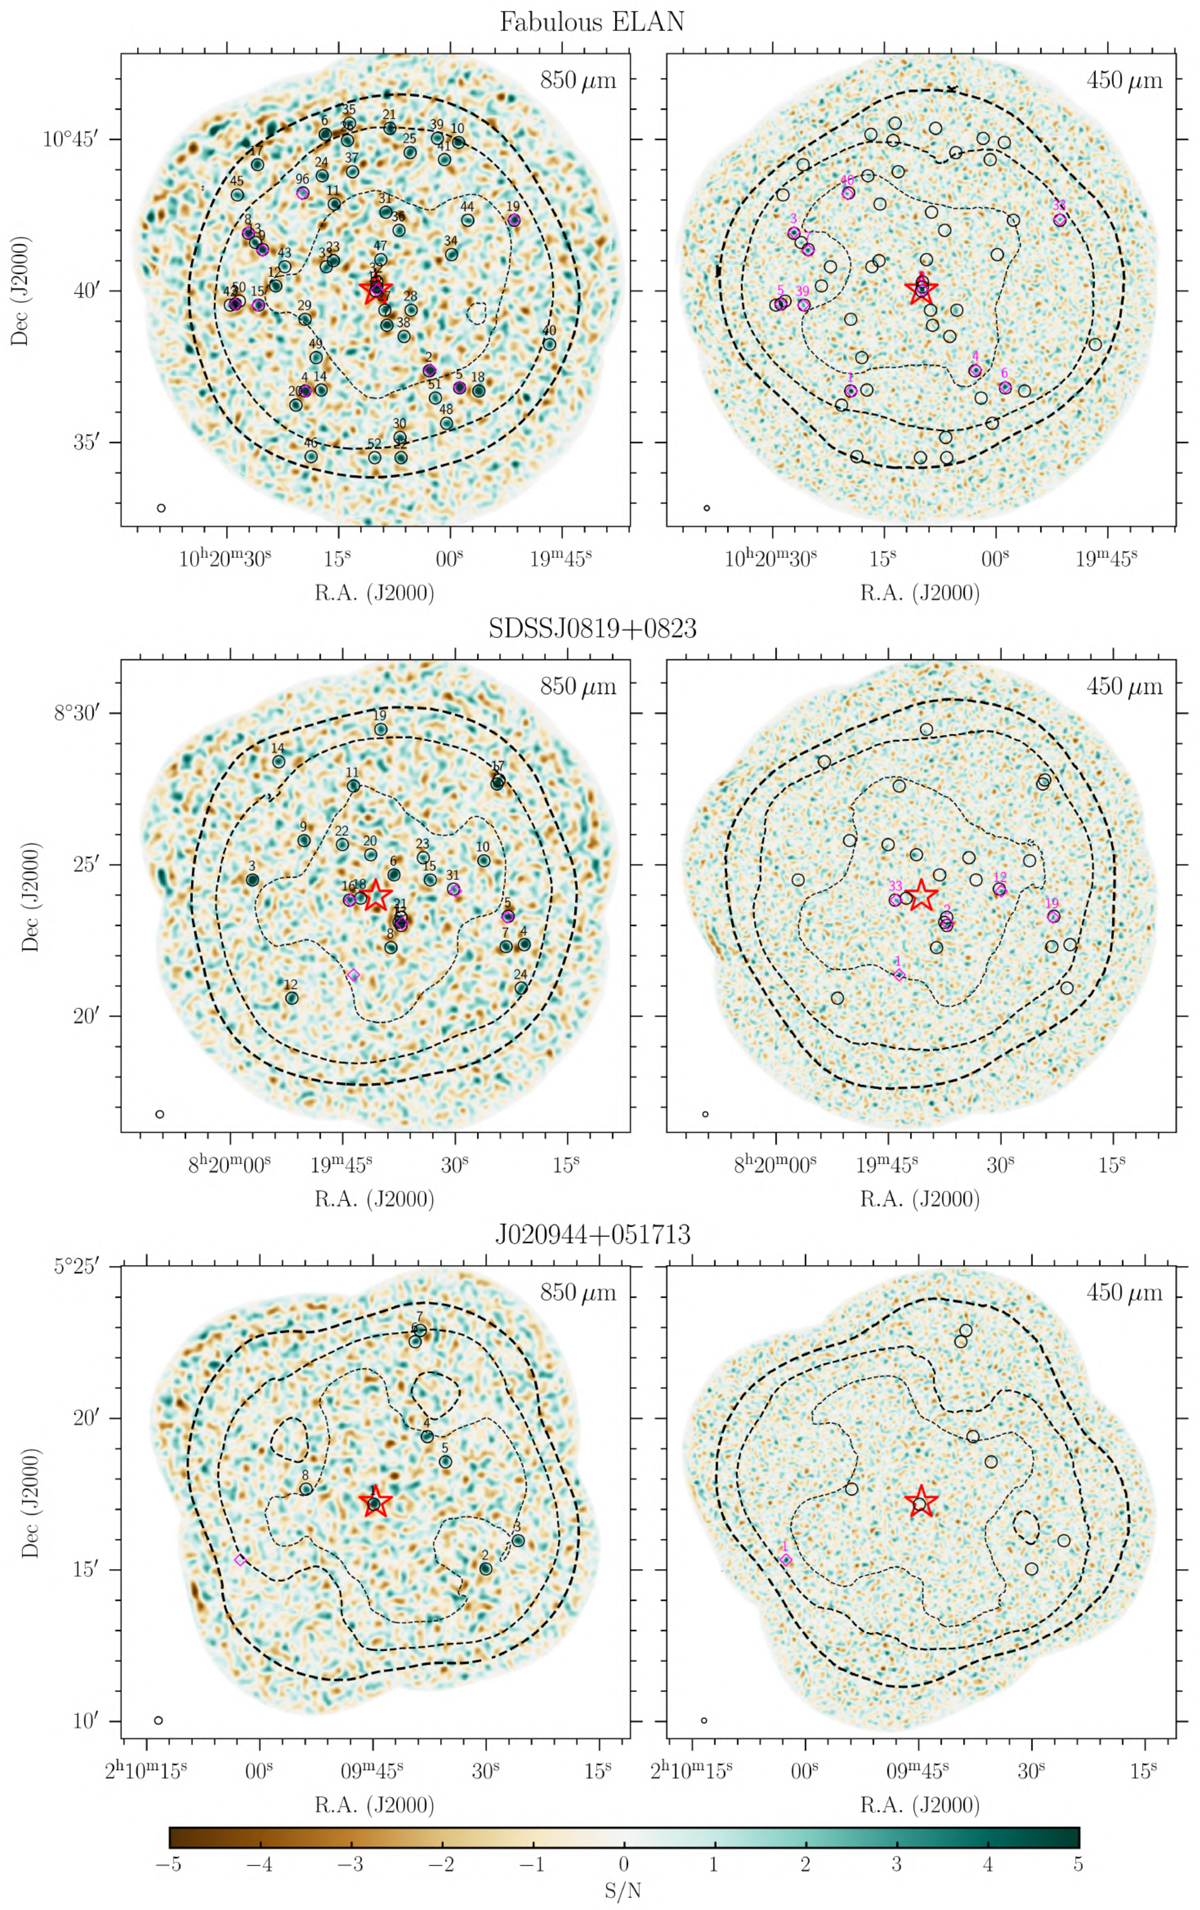
SCUBA-2 S/N maps at 850 μm (left column) and 450 μm (right column) for three example fields: one ELAN (Fabulous), the most overdense quasar field (SDSSJ 0819+0823), and one of the least overdense quasar fields (J020944+051713). The size of each panel is about 15′×15′. The red star in each panel indicates the location of the ELAN and quasars. The 850 and 450 μm detections with corresponding ID numbers are highlighted as black circles and magenta diamonds, respectively. For each map, we indicate the noise contours (black dashed) for levels of 1.5, 2, and 3 times the central noise, the last of which defines the outer boundary for source extraction (Table 1). The 850 and 450 μm maps for all other fields are shown in Appendix C.
Current usage metrics show cumulative count of Article Views (full-text article views including HTML views, PDF and ePub downloads, according to the available data) and Abstracts Views on Vision4Press platform.
Data correspond to usage on the plateform after 2015. The current usage metrics is available 48-96 hours after online publication and is updated daily on week days.
Initial download of the metrics may take a while.