Fig. 10.
Download original image
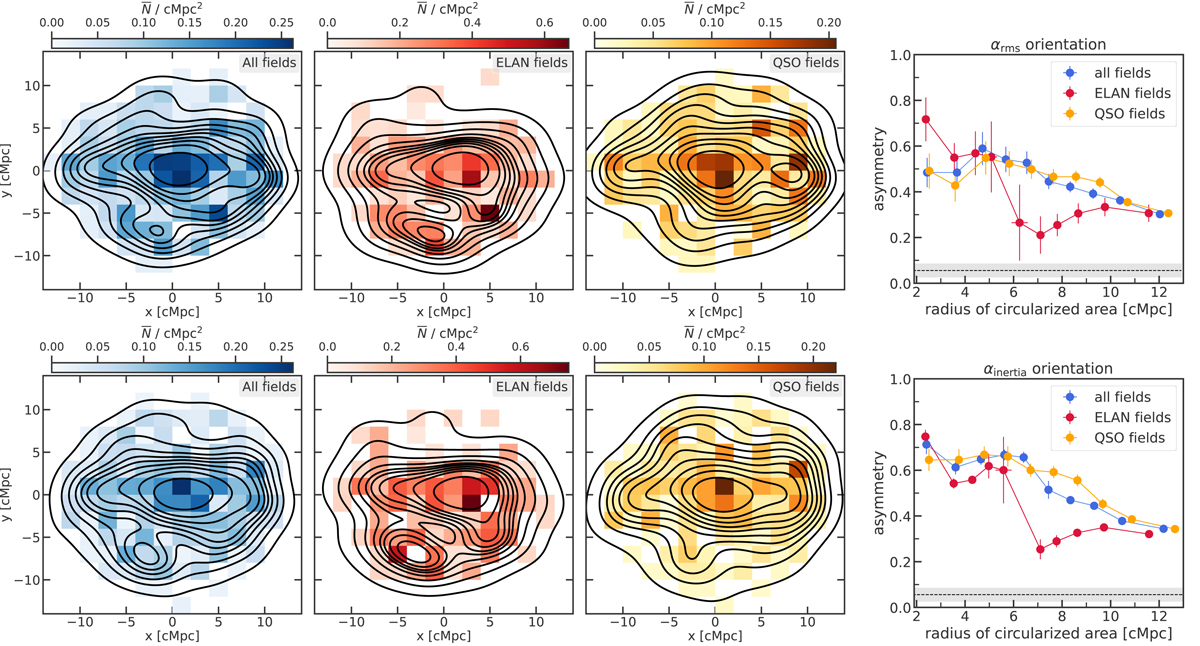
Stacked source distribution maps and their asymmetry profiles. Left: stacked maps of mean number of sources per cMpc2 for all the fields (left), only the ELANe (center), and only the quasar fields (right). For the maps on the top row the preferred direction is given by αrms and the ones on the bottom by αinertia. The black contours in each map enclose increasing fractions of sources from 0.1 for the innermost contour to 1.0 for the outermost one in steps of 0.1. Right: asymmetry profiles of the stacked source distribution maps. The x-axis gives the radius of the circularized area of the contours, ![]() , in comoving megaparsecs. From left to right, the points correspond to the asymmetry within the contours enclosing increasing fractions of sources, from 0.1 to 1.0 in steps of 0.1. For the profiles in the top panel, the stacking has been done after rotating each field by its αrms, while for the ones in the bottom panel the fields have been rotated by αinertia. The horizontal dashed black line together with its gray band (in both panels) marks the level of asymmetry of 0.06 ± 0.03 corresponding to stacks of all 20 fields where the positions of the sources have been randomized.
, in comoving megaparsecs. From left to right, the points correspond to the asymmetry within the contours enclosing increasing fractions of sources, from 0.1 to 1.0 in steps of 0.1. For the profiles in the top panel, the stacking has been done after rotating each field by its αrms, while for the ones in the bottom panel the fields have been rotated by αinertia. The horizontal dashed black line together with its gray band (in both panels) marks the level of asymmetry of 0.06 ± 0.03 corresponding to stacks of all 20 fields where the positions of the sources have been randomized.
Current usage metrics show cumulative count of Article Views (full-text article views including HTML views, PDF and ePub downloads, according to the available data) and Abstracts Views on Vision4Press platform.
Data correspond to usage on the plateform after 2015. The current usage metrics is available 48-96 hours after online publication and is updated daily on week days.
Initial download of the metrics may take a while.