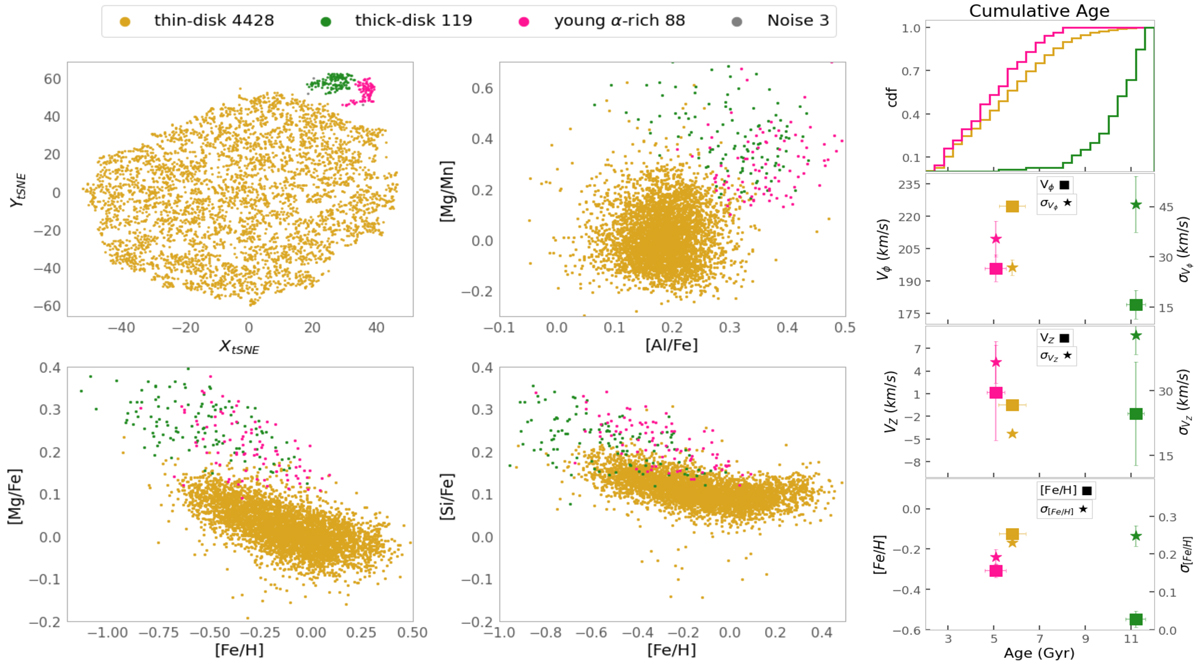
Fig. 4.
Download original image
General results of the t-SNE+HDBSCAN application. Upper-left panel: t-SNE projection for SGB stars in APOGEE DR17. Colours correspond to different groups found by t-SNE+HDBSCAN on the data. Lower-left and middle panels: abundance ratios of α elements to those of the iron group plotted against metallicity using the same colours for each identified group. Right panels (from top to bottom: i): (i) cumulative age distribution for each group; (ii) mean azimuthal velocity (left y-axis and square symbol) and mean dispersion in azimuthal velocity (right y-axis and star symbol) for each group as a function of age; (iii) mean vertical velocity (left y-axis and square symbol) and mean dispersion in vertical velocity (right y-axis and star symbol) for each group as a function of age; (iv) mean metallicity (left y-axis and square symbol) and mean dispersion in metallicity (right y-axis and star symbol) for each group as a function of age. The error bars in the right panels represent the 95% confidence interval of a bootstrap resampling.
Current usage metrics show cumulative count of Article Views (full-text article views including HTML views, PDF and ePub downloads, according to the available data) and Abstracts Views on Vision4Press platform.
Data correspond to usage on the plateform after 2015. The current usage metrics is available 48-96 hours after online publication and is updated daily on week days.
Initial download of the metrics may take a while.