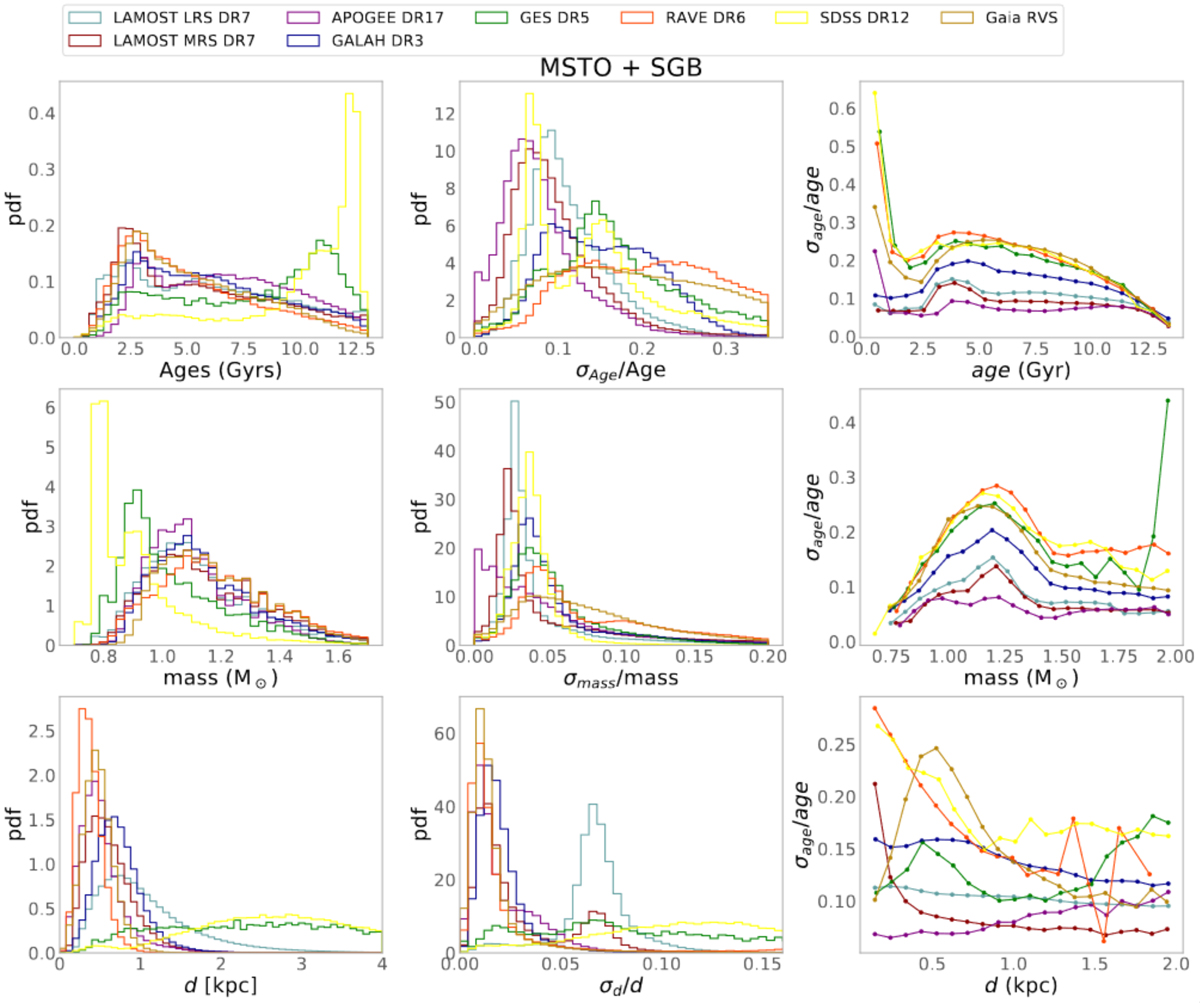
Fig. 1.
Download original image
Distributions of ages, masses, distances, and their uncertainties for the MSTO+SGB samples. The y-axis shows the probability density. All histograms are normalised so that the area under the histogram integrates to 1. The right panels show the mean age uncertainty per bin of age, mass, and distance for each survey.
Current usage metrics show cumulative count of Article Views (full-text article views including HTML views, PDF and ePub downloads, according to the available data) and Abstracts Views on Vision4Press platform.
Data correspond to usage on the plateform after 2015. The current usage metrics is available 48-96 hours after online publication and is updated daily on week days.
Initial download of the metrics may take a while.