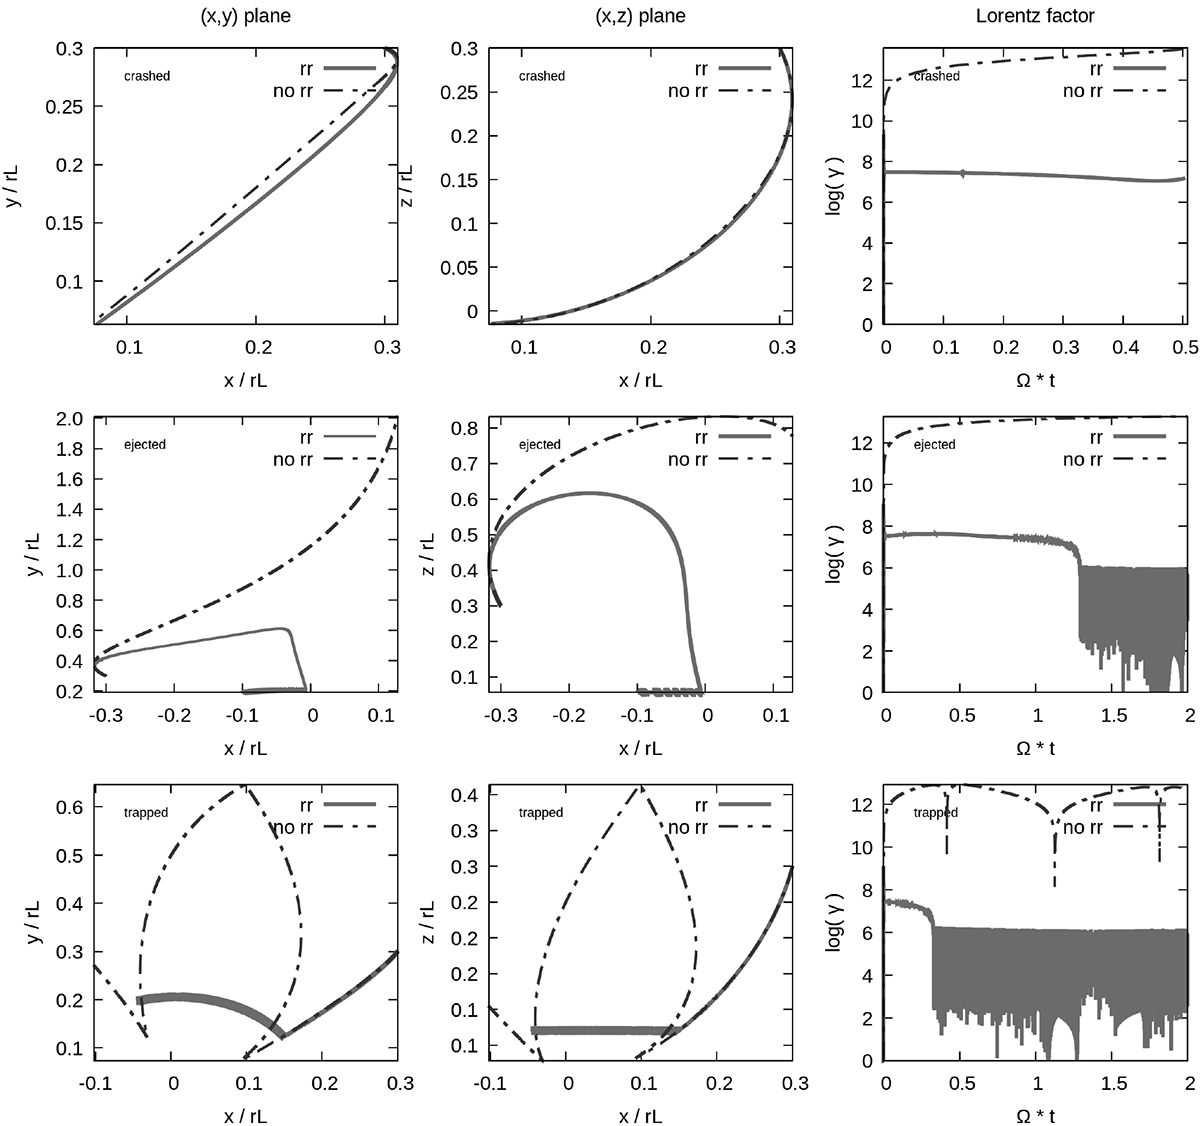
Fig. 12.
Download original image
Two trajectories of the same particle injected at the same location but with radiation reaction in one case(‘rr’, in red solid lines) and without it in the other (‘no rr’, in dash-dotted blue lines). The upper panel corresponds to a crashed particle, the middle panel to an ejected particle, and the bottom panel to a trapped particle. The left column projects the trajectory on the (x, y) plane, the middle column projects it on the (x, z) plane, and the right column shows the evolution of the Lorentz factor in a log scale.
Current usage metrics show cumulative count of Article Views (full-text article views including HTML views, PDF and ePub downloads, according to the available data) and Abstracts Views on Vision4Press platform.
Data correspond to usage on the plateform after 2015. The current usage metrics is available 48-96 hours after online publication and is updated daily on week days.
Initial download of the metrics may take a while.