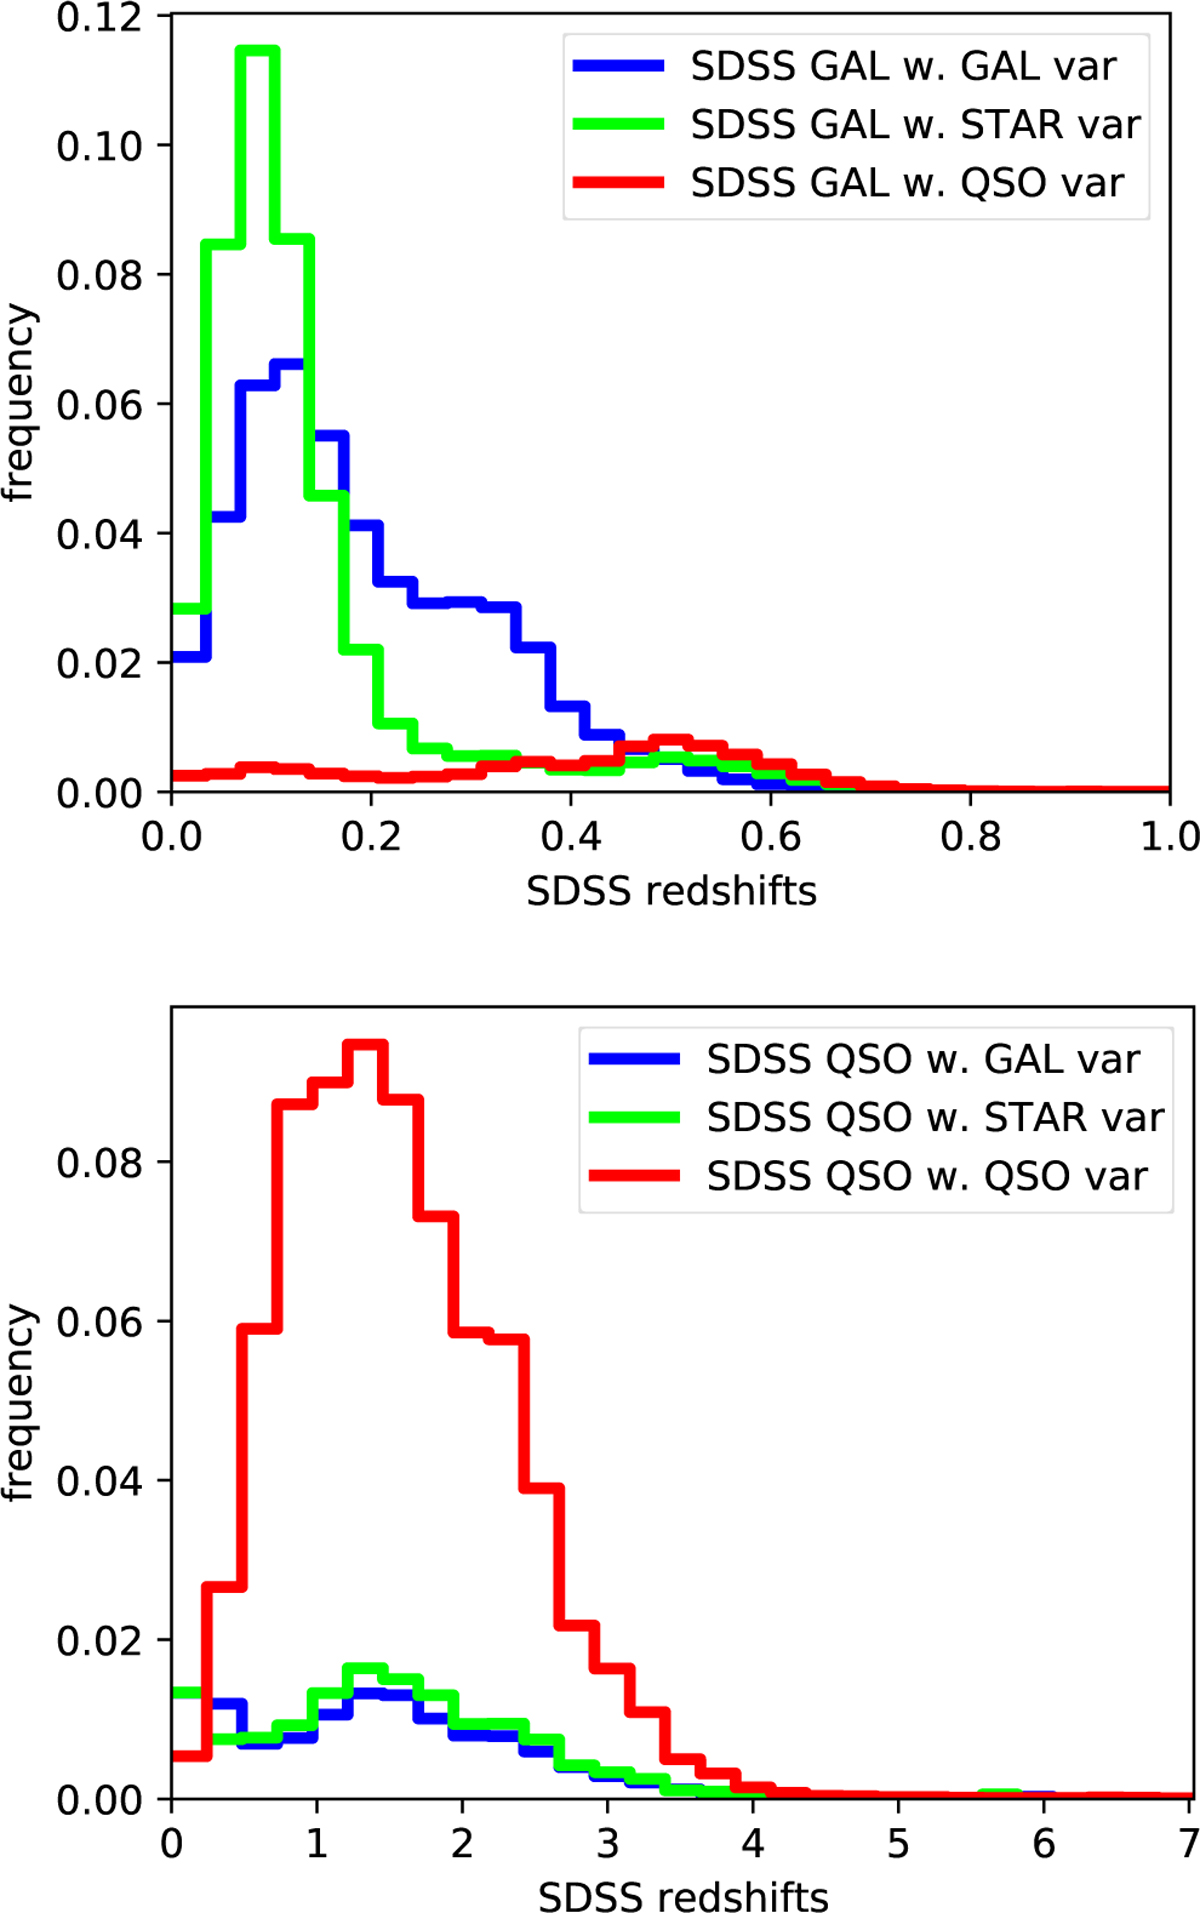
Fig. C.1
Download original image
Redshift distributions of galaxies (top) and QSOs (bottom) that appear as candidates of different classes based on variability criteria. The galaxies with QSO-like high variability are typically found at high redshifts of ~0.5, and those with star-like low variability have lower redshifts than other galaxies. SDSS QSOs are dominated by QSO-like variability except at z < 0.3. The bins of each diagram are normalised with respect to the total samples of spectroscopic SDSS galaxies and QSOs, respectively.
Current usage metrics show cumulative count of Article Views (full-text article views including HTML views, PDF and ePub downloads, according to the available data) and Abstracts Views on Vision4Press platform.
Data correspond to usage on the plateform after 2015. The current usage metrics is available 48-96 hours after online publication and is updated daily on week days.
Initial download of the metrics may take a while.