Open Access
Fig. A.1
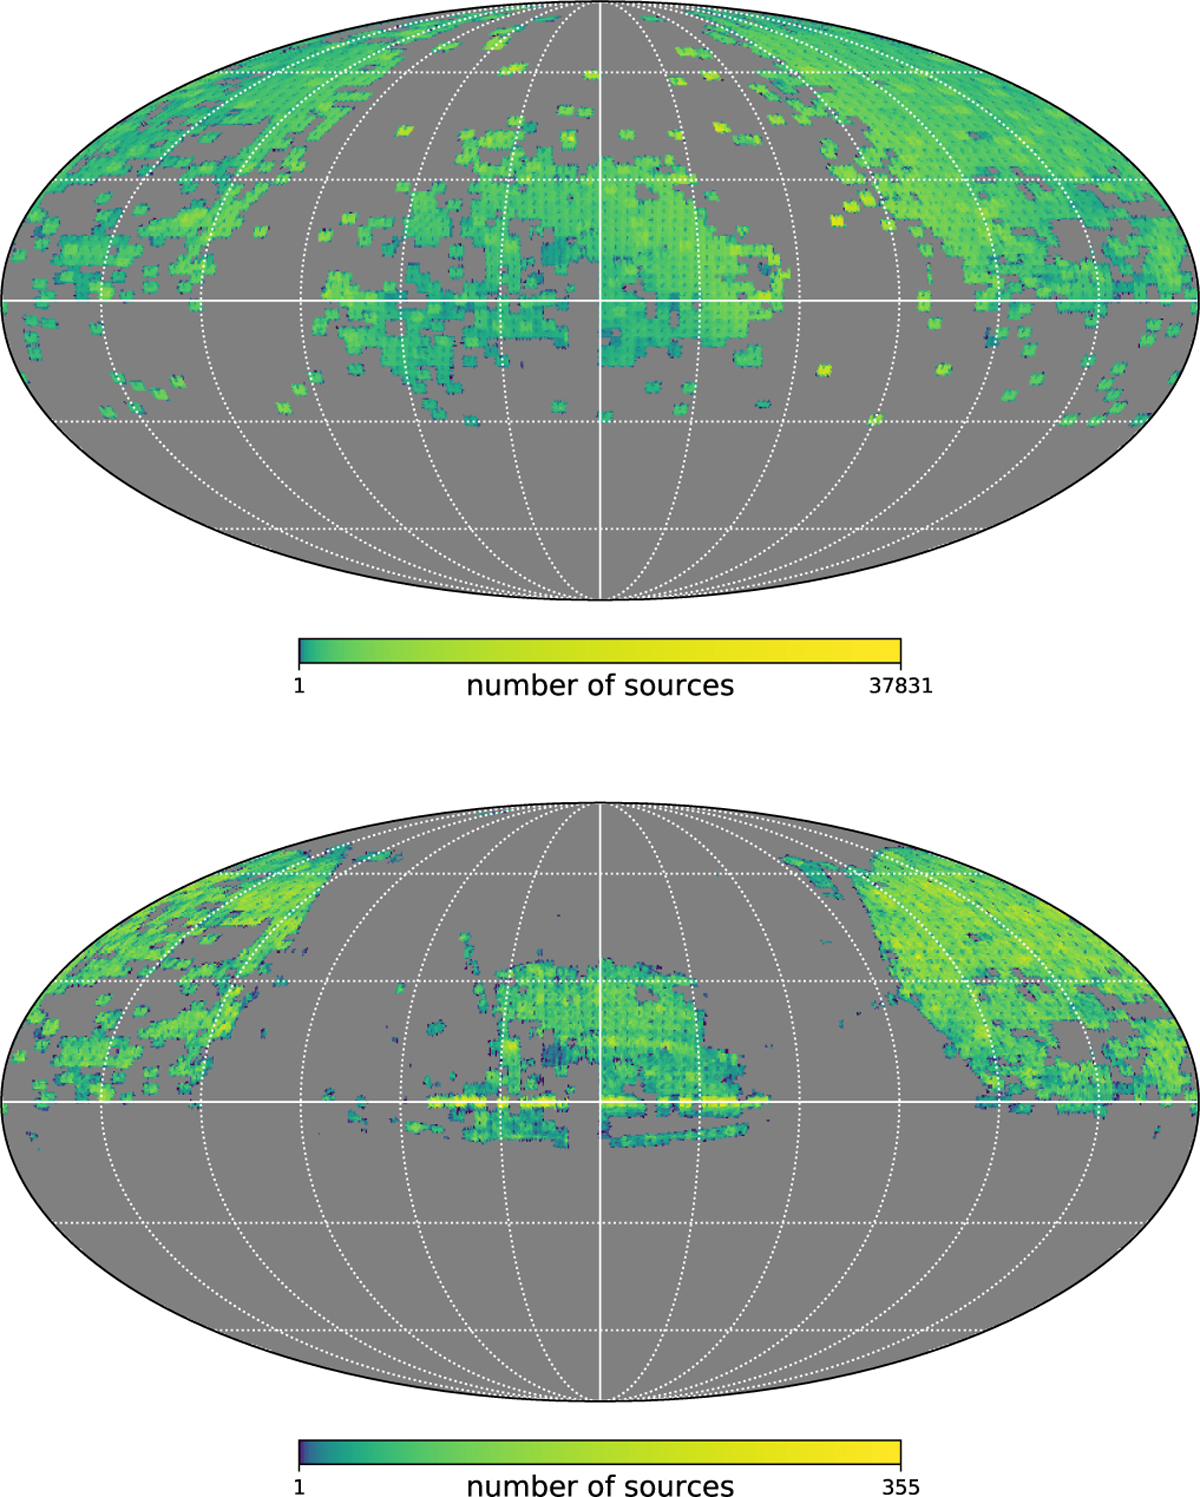
Download original image
Sky distributions of fitted and accepted PTF light curves (top) and of those also matched to spectroscopic classifications in SDSS (bottom). The coordinates are equatorial, with RA increasing to the right. In grey areas, no data exist or remain after the data cleaning of Sect. 2.5.
Current usage metrics show cumulative count of Article Views (full-text article views including HTML views, PDF and ePub downloads, according to the available data) and Abstracts Views on Vision4Press platform.
Data correspond to usage on the plateform after 2015. The current usage metrics is available 48-96 hours after online publication and is updated daily on week days.
Initial download of the metrics may take a while.