Fig. 2
Download original image
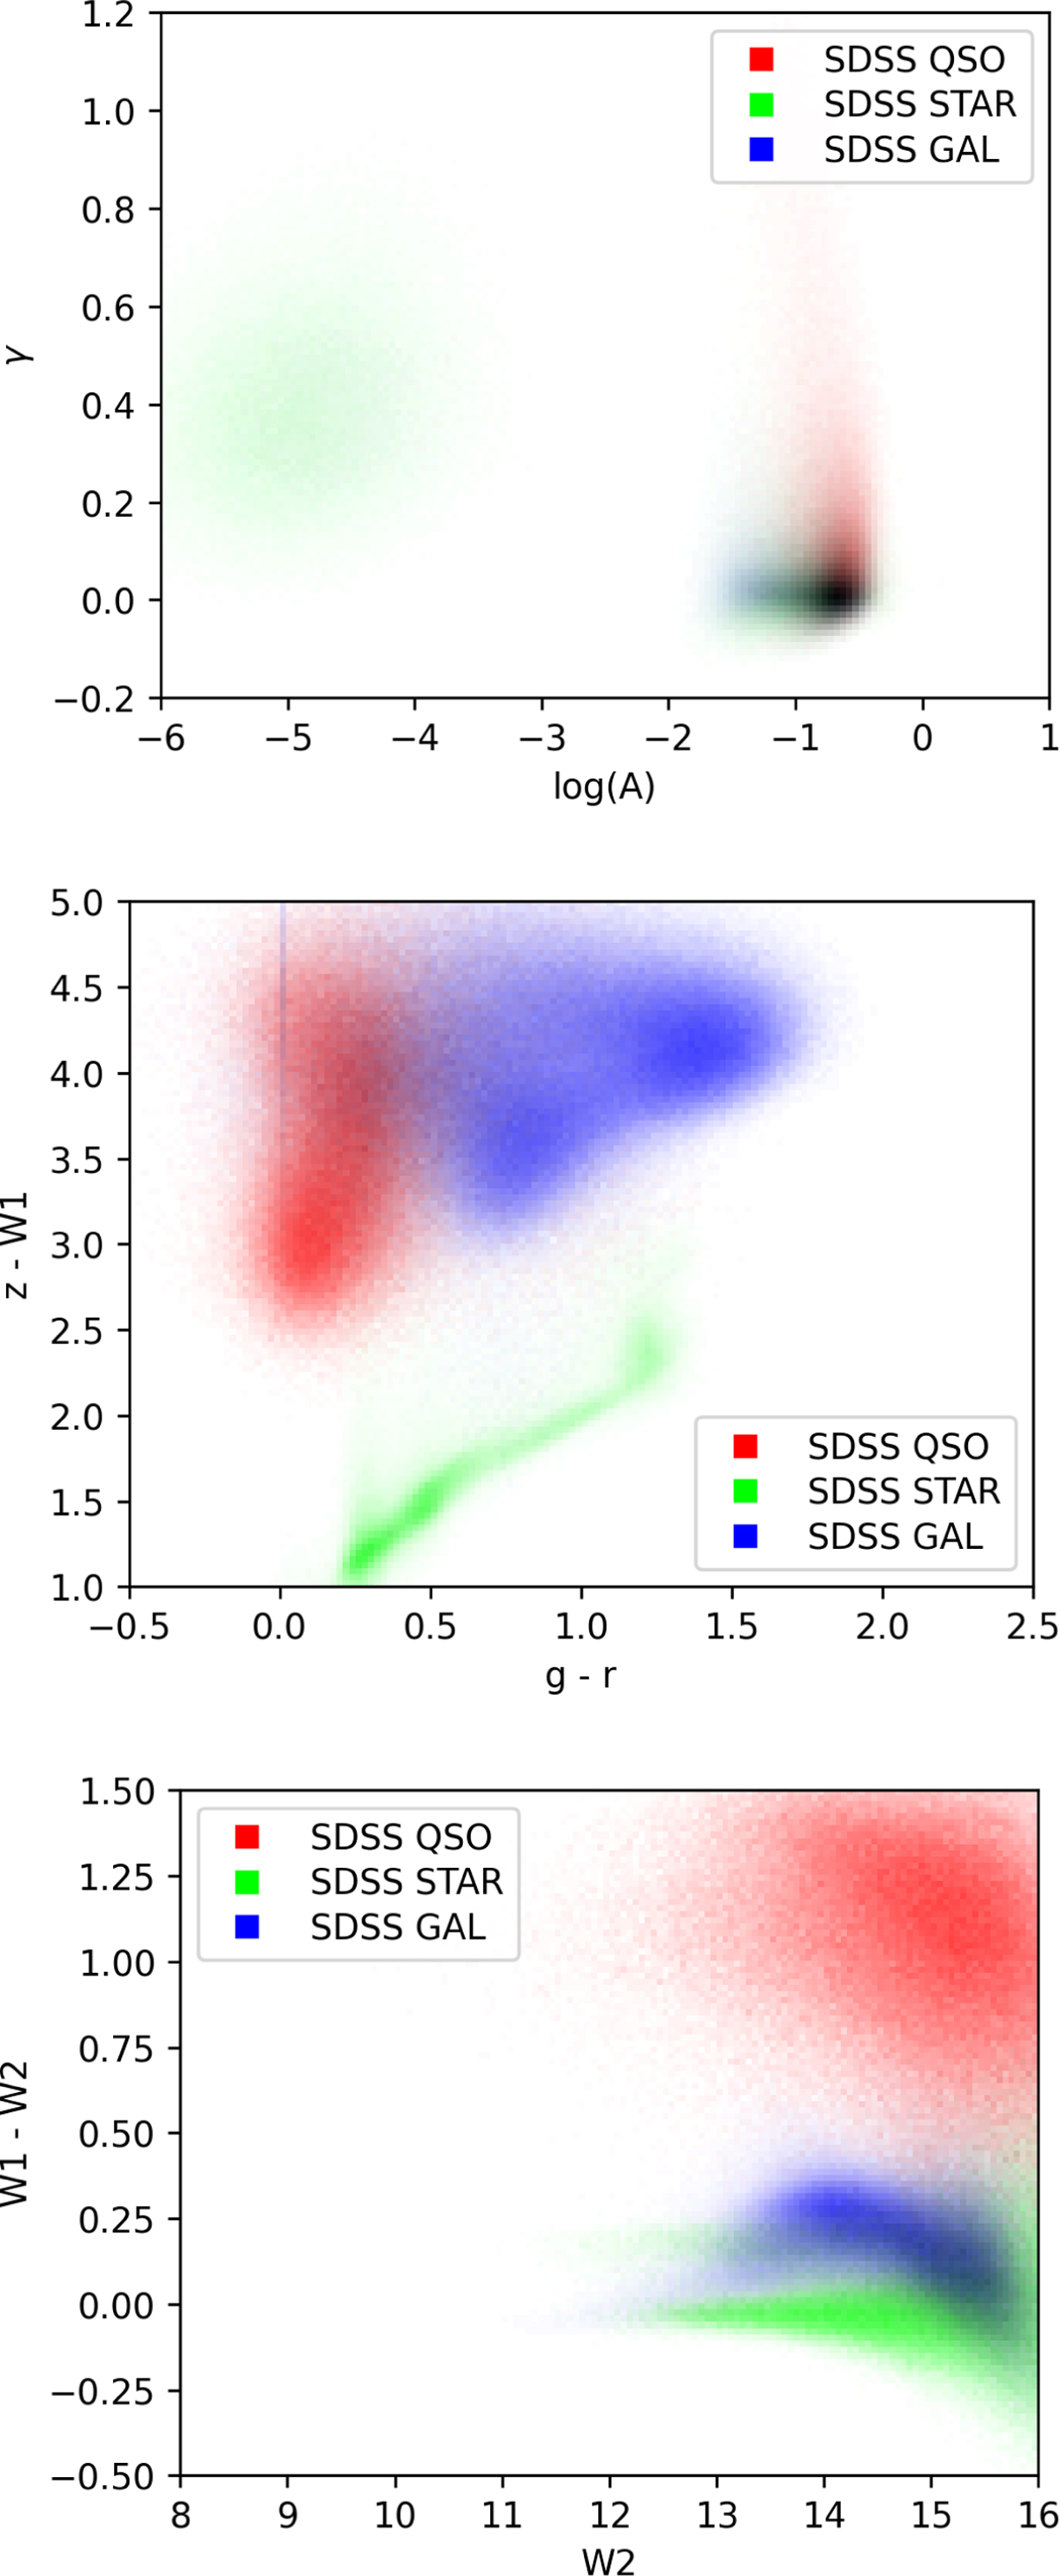
All spectroscopically confirmed stars (green), QSOs (red) and galaxies (blue) from SDSS plotted in variability fit parameters (top) and colours: g – r vs. z – W1 (middle) and W2 vs. W1 – W2 (bottom). Marker colours show the object class and blend to grey or black when multiple classes occupy the same parameter region. A heat map of all spectroscopically confirmed objects is found in Fig. B.2 for comparison with Fig. 1.
Current usage metrics show cumulative count of Article Views (full-text article views including HTML views, PDF and ePub downloads, according to the available data) and Abstracts Views on Vision4Press platform.
Data correspond to usage on the plateform after 2015. The current usage metrics is available 48-96 hours after online publication and is updated daily on week days.
Initial download of the metrics may take a while.