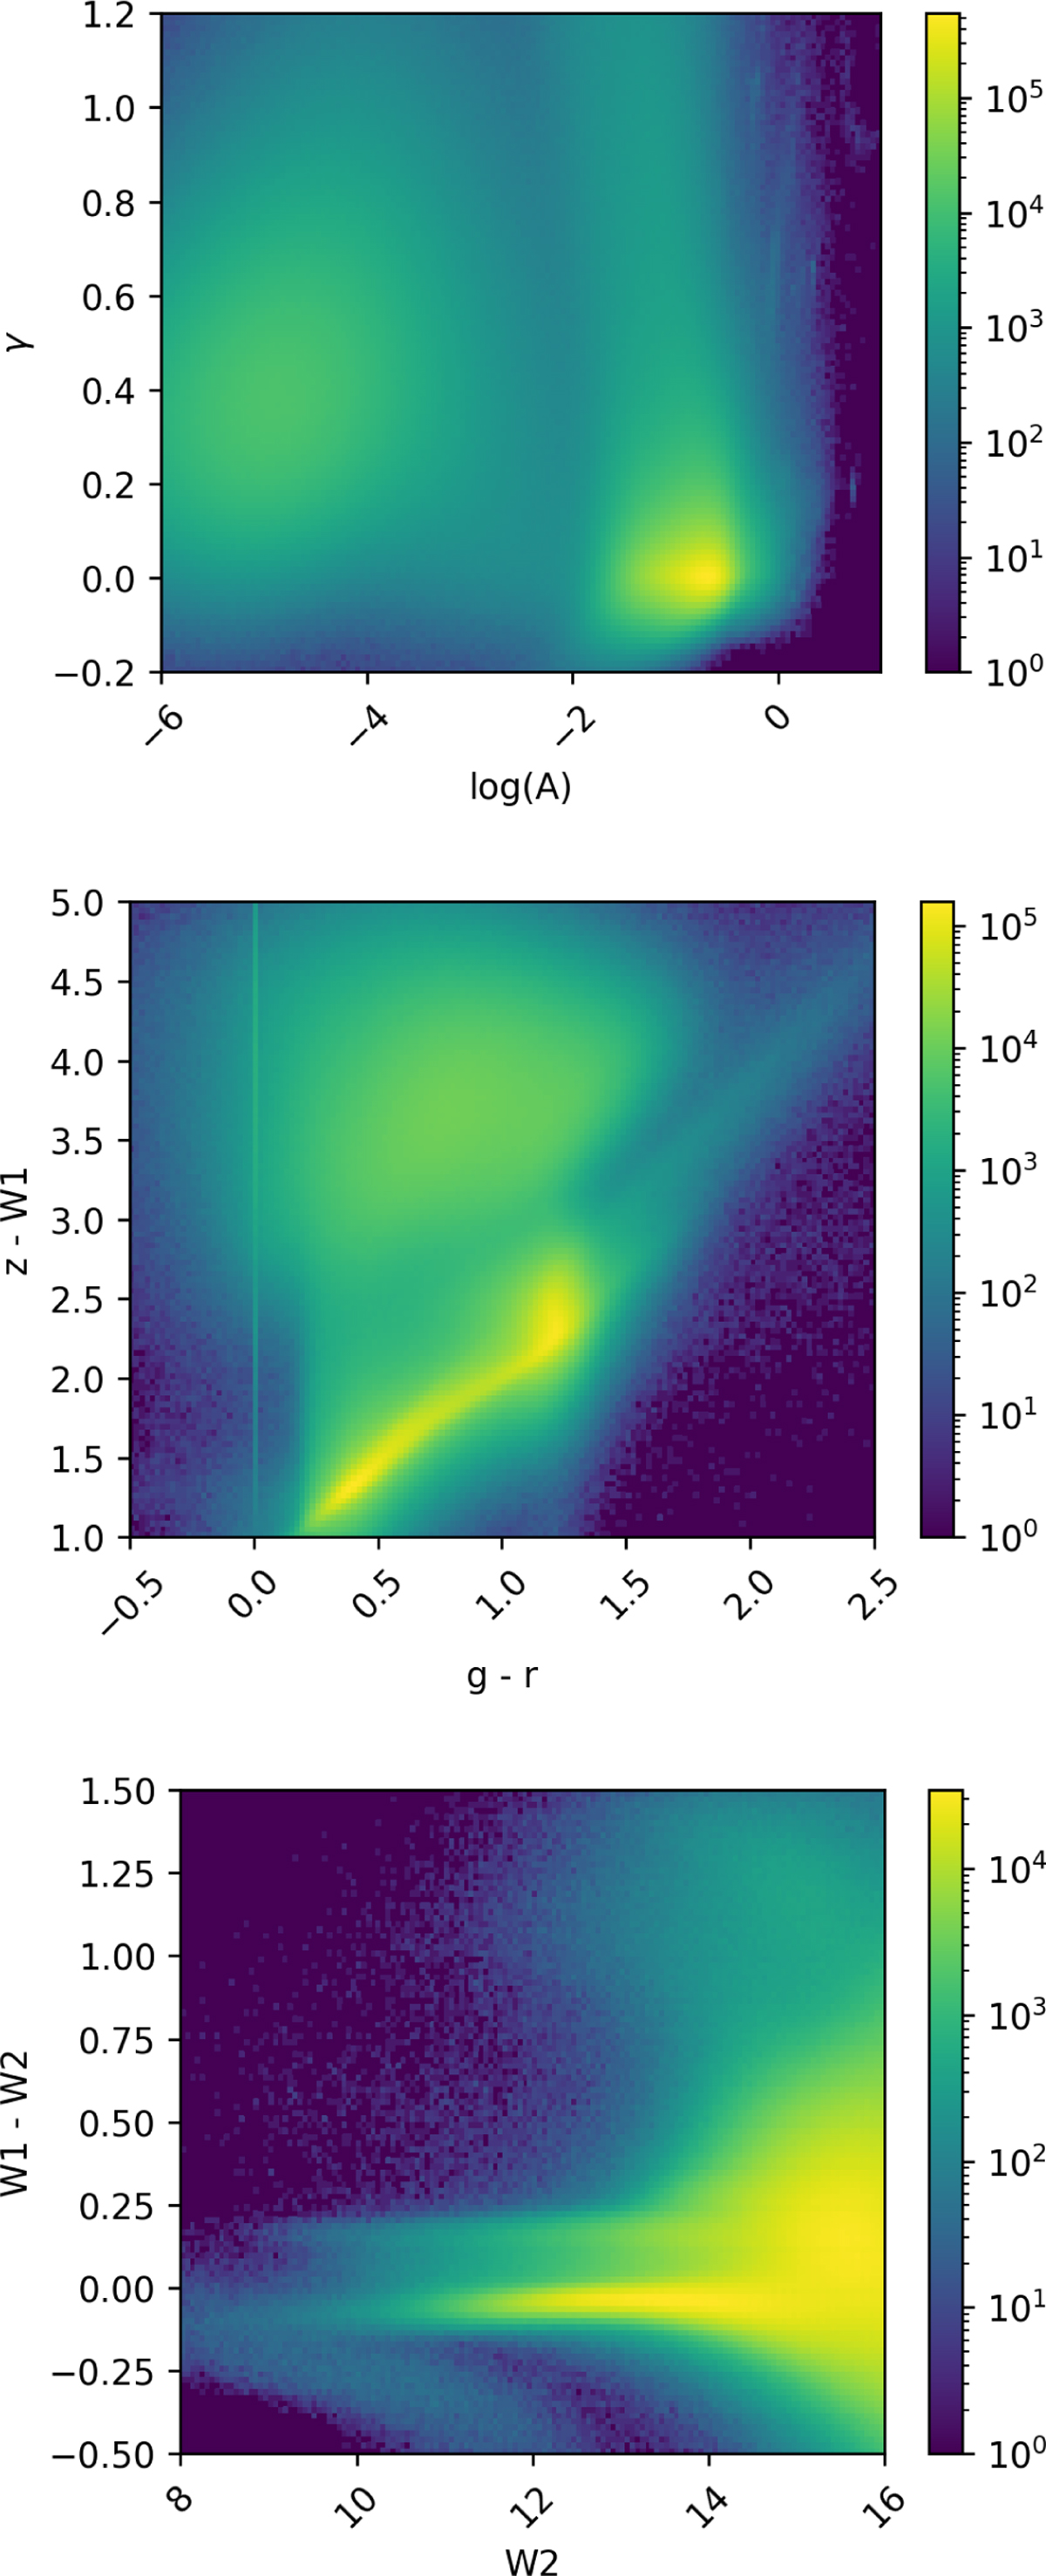
Fig. 1
Download original image
Heat maps of variability parameters (top), g – r vs. z – W1 (middle) and W2 vs. W1 – W2 (bottom). These are the full parameter distributions of objects with light curves in PTF after cleaning and matching with other surveys as necessary. Two large clusters are observed in Α-γ-space. Selection criteria are applied to this data for analysis of candidate QSOs, stars and galaxies. log(A) is in base 10 and based on A units of in magnitudes.
Current usage metrics show cumulative count of Article Views (full-text article views including HTML views, PDF and ePub downloads, according to the available data) and Abstracts Views on Vision4Press platform.
Data correspond to usage on the plateform after 2015. The current usage metrics is available 48-96 hours after online publication and is updated daily on week days.
Initial download of the metrics may take a while.