Open Access
Fig. 8.
Download original image
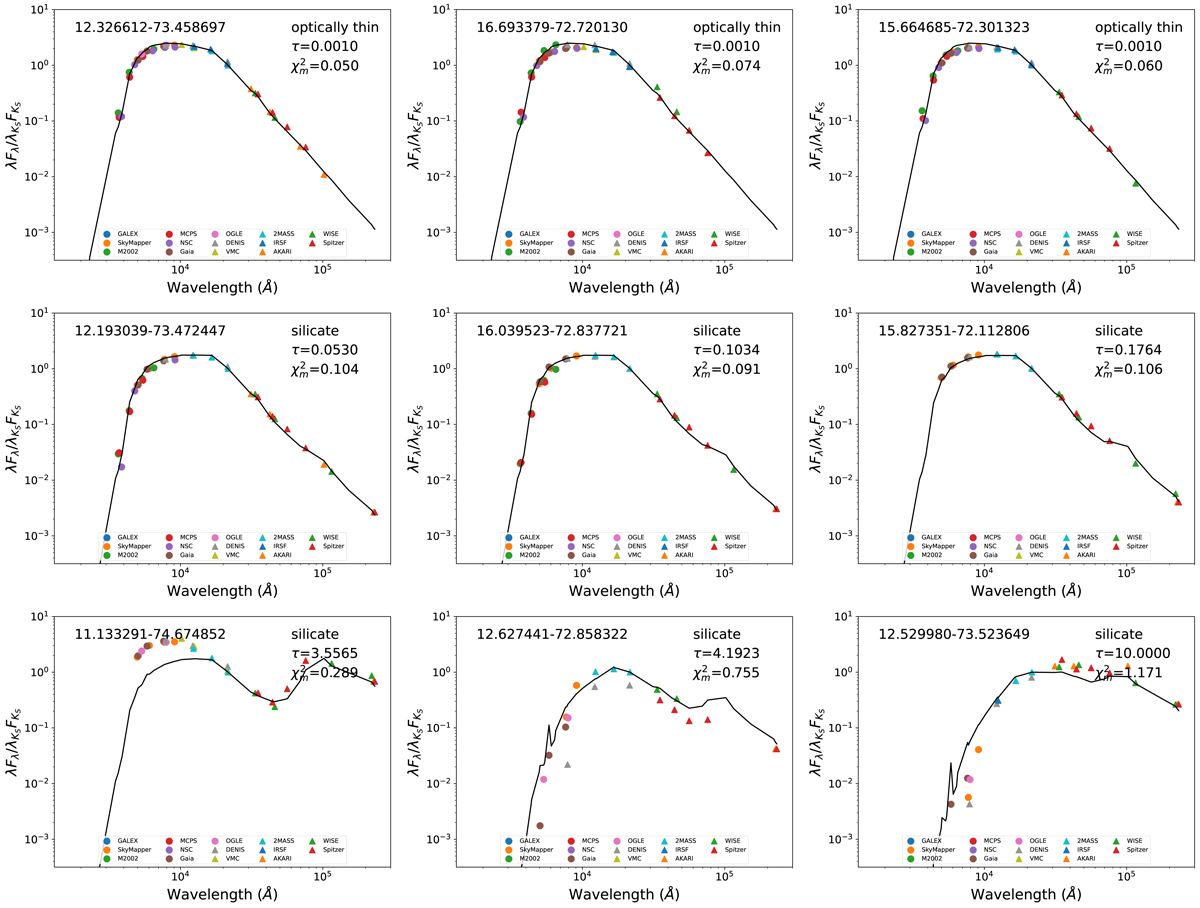
Examples of the typical SED fitting for optically thin (upper row), normal (middle row), and very dusty targets (bottom row). In each panel, the coordinate is marked on the upper left, and chemical composition, τ, and ![]() are marked on the upper right.
are marked on the upper right.
Current usage metrics show cumulative count of Article Views (full-text article views including HTML views, PDF and ePub downloads, according to the available data) and Abstracts Views on Vision4Press platform.
Data correspond to usage on the plateform after 2015. The current usage metrics is available 48-96 hours after online publication and is updated daily on week days.
Initial download of the metrics may take a while.