Open Access
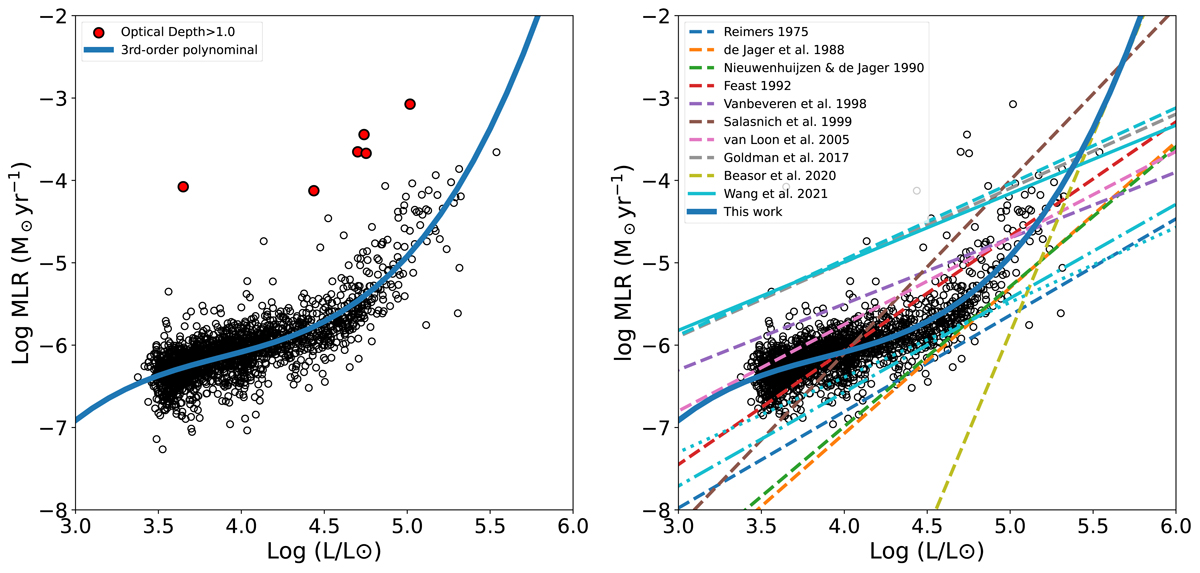
Fig. 15.
Download original image
Derived MLR–L relation from this work (left) and comparison of the same relation between this and previous works (right). In the left panel, the very dusty targets (τ > 1.0) are marked in red. In the right panel, lines of the same color are variations of the same relation (as shown in Fig. 16).
Current usage metrics show cumulative count of Article Views (full-text article views including HTML views, PDF and ePub downloads, according to the available data) and Abstracts Views on Vision4Press platform.
Data correspond to usage on the plateform after 2015. The current usage metrics is available 48-96 hours after online publication and is updated daily on week days.
Initial download of the metrics may take a while.