Fig. 13.
Download original image
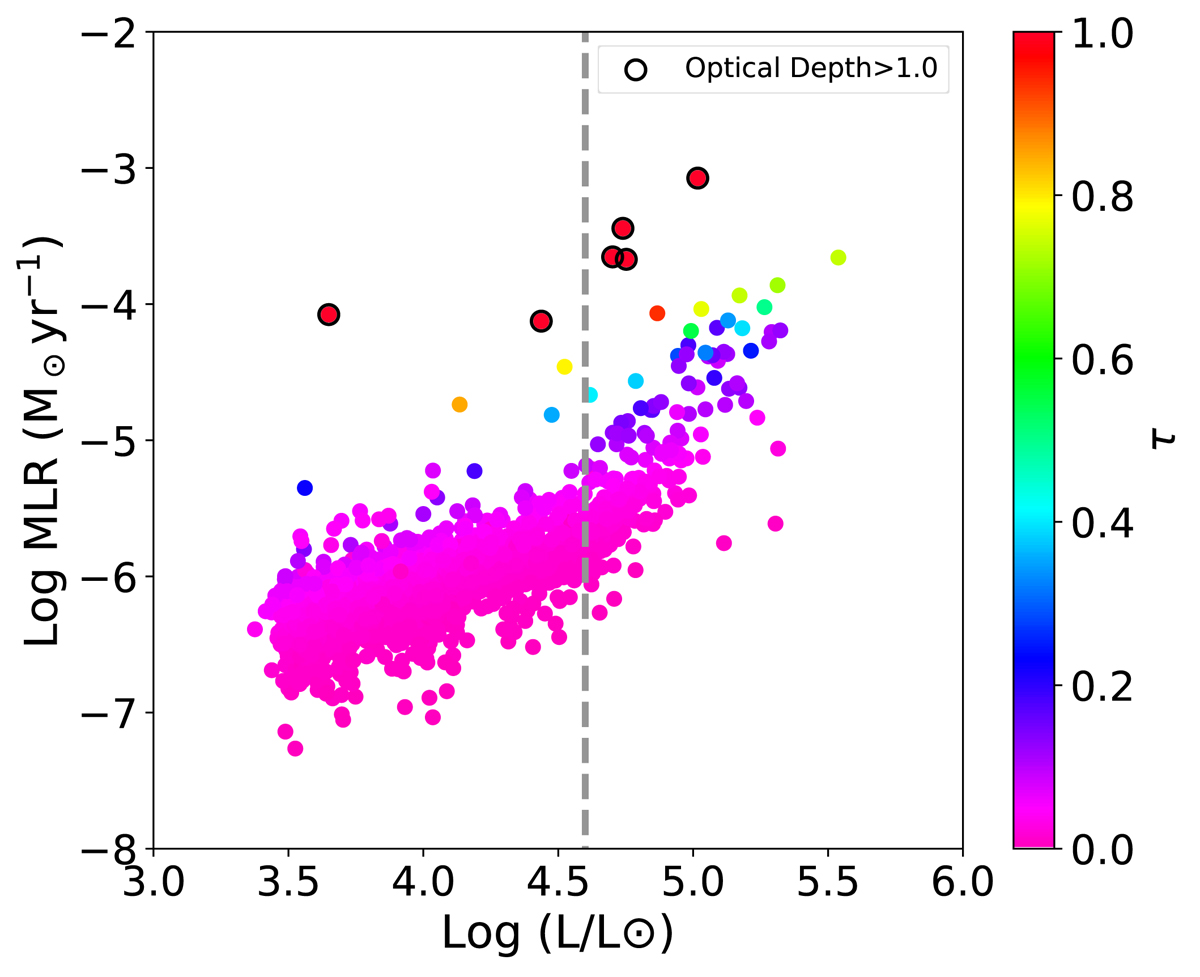
Luminosity versus MLR diagrams for the final RSG sample. Targets are color-coded with τ, while targets with very large τ (>1.0) are marked by the open circles in the diagram. The dashed line indicates the luminosity of log10(L/L⊙) = 4.6. We note that the low-luminosity targets (log10(L/L⊙)≲4.0) may not be true RSGs, but ∼6 − 8 M⊙ red helium-burning stars.
Current usage metrics show cumulative count of Article Views (full-text article views including HTML views, PDF and ePub downloads, according to the available data) and Abstracts Views on Vision4Press platform.
Data correspond to usage on the plateform after 2015. The current usage metrics is available 48-96 hours after online publication and is updated daily on week days.
Initial download of the metrics may take a while.