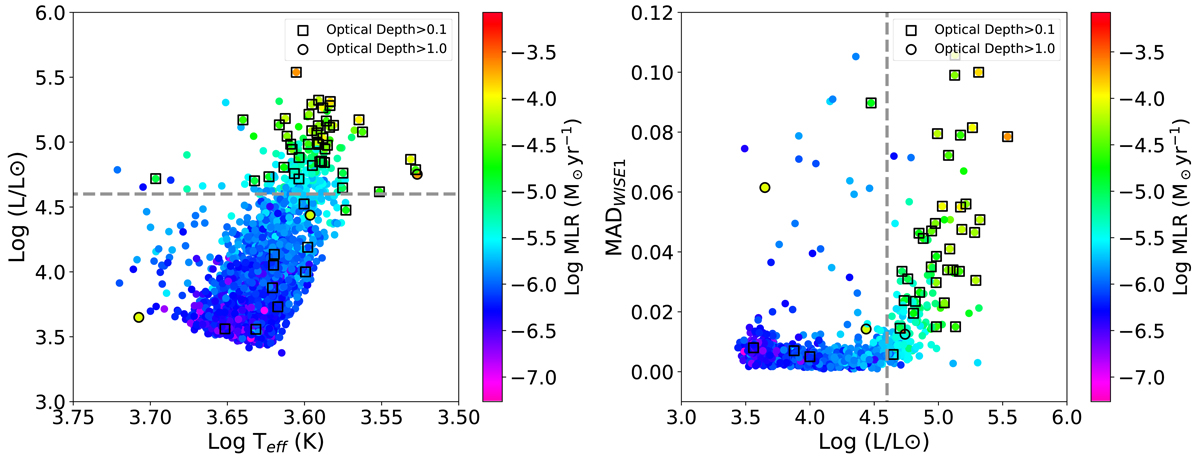
Fig. 12.
Download original image
Hertzsprung-Russell (left) and luminosity versus MAD (right) diagrams for the final RSG sample. Targets are color-coded with the MLR, while targets with relatively large (> 0.1) and very large (> 1.0) τ are marked by the open squares and open circles in the diagram, respectively. The dashed lines indicate the luminosity of log10(L/L⊙) = 4.6. For clarity, only the general population (without the extreme outliers) of the sample is shown in the diagram. In the luminosity versus MAD diagram, there are a few targets showing large MAD with low luminosity and MLR, which are mostly targets crossing the instability strip (because of their large variability, their is Teff variable, meaning that sometimes they are RSGs and sometimes they are yellow supergiants).
Current usage metrics show cumulative count of Article Views (full-text article views including HTML views, PDF and ePub downloads, according to the available data) and Abstracts Views on Vision4Press platform.
Data correspond to usage on the plateform after 2015. The current usage metrics is available 48-96 hours after online publication and is updated daily on week days.
Initial download of the metrics may take a while.